Workflows, Best Practice guidance, Tips and Tricks to extract the best from Hammer Missions
In this walkthrough we will show you how easy the Hammer Missions platform makes it to extract key deficiency information from your project, into a polished PDF report which you can quickly share with colleagues, clients or other partners. The report generator in Hammer Hub lets you customise content, branding and annotated image information, all with just a few clicks.
If you prefer to watch a video on this topic use the link immediately below, otherwise skip over it to the Blog article
https://www.loom.com/share/de417c6843a04e5a88aa31ab0004c7e8?sid=74fff02f-daff-41ce-9119-bdcc9a67874a
Within Hammer Hub, access the Data Analysis area and open your project. From here click on the Report icon in the top right corner. In the panel that appears, you can choose options like which type of images and annotations to include, add a short introduction and your own branding aesthetics, as well as further customisations. When you hit the 'Generate Report' option, a PDF output file will be created which summarises the inspection with images, tables and direct links to defects.
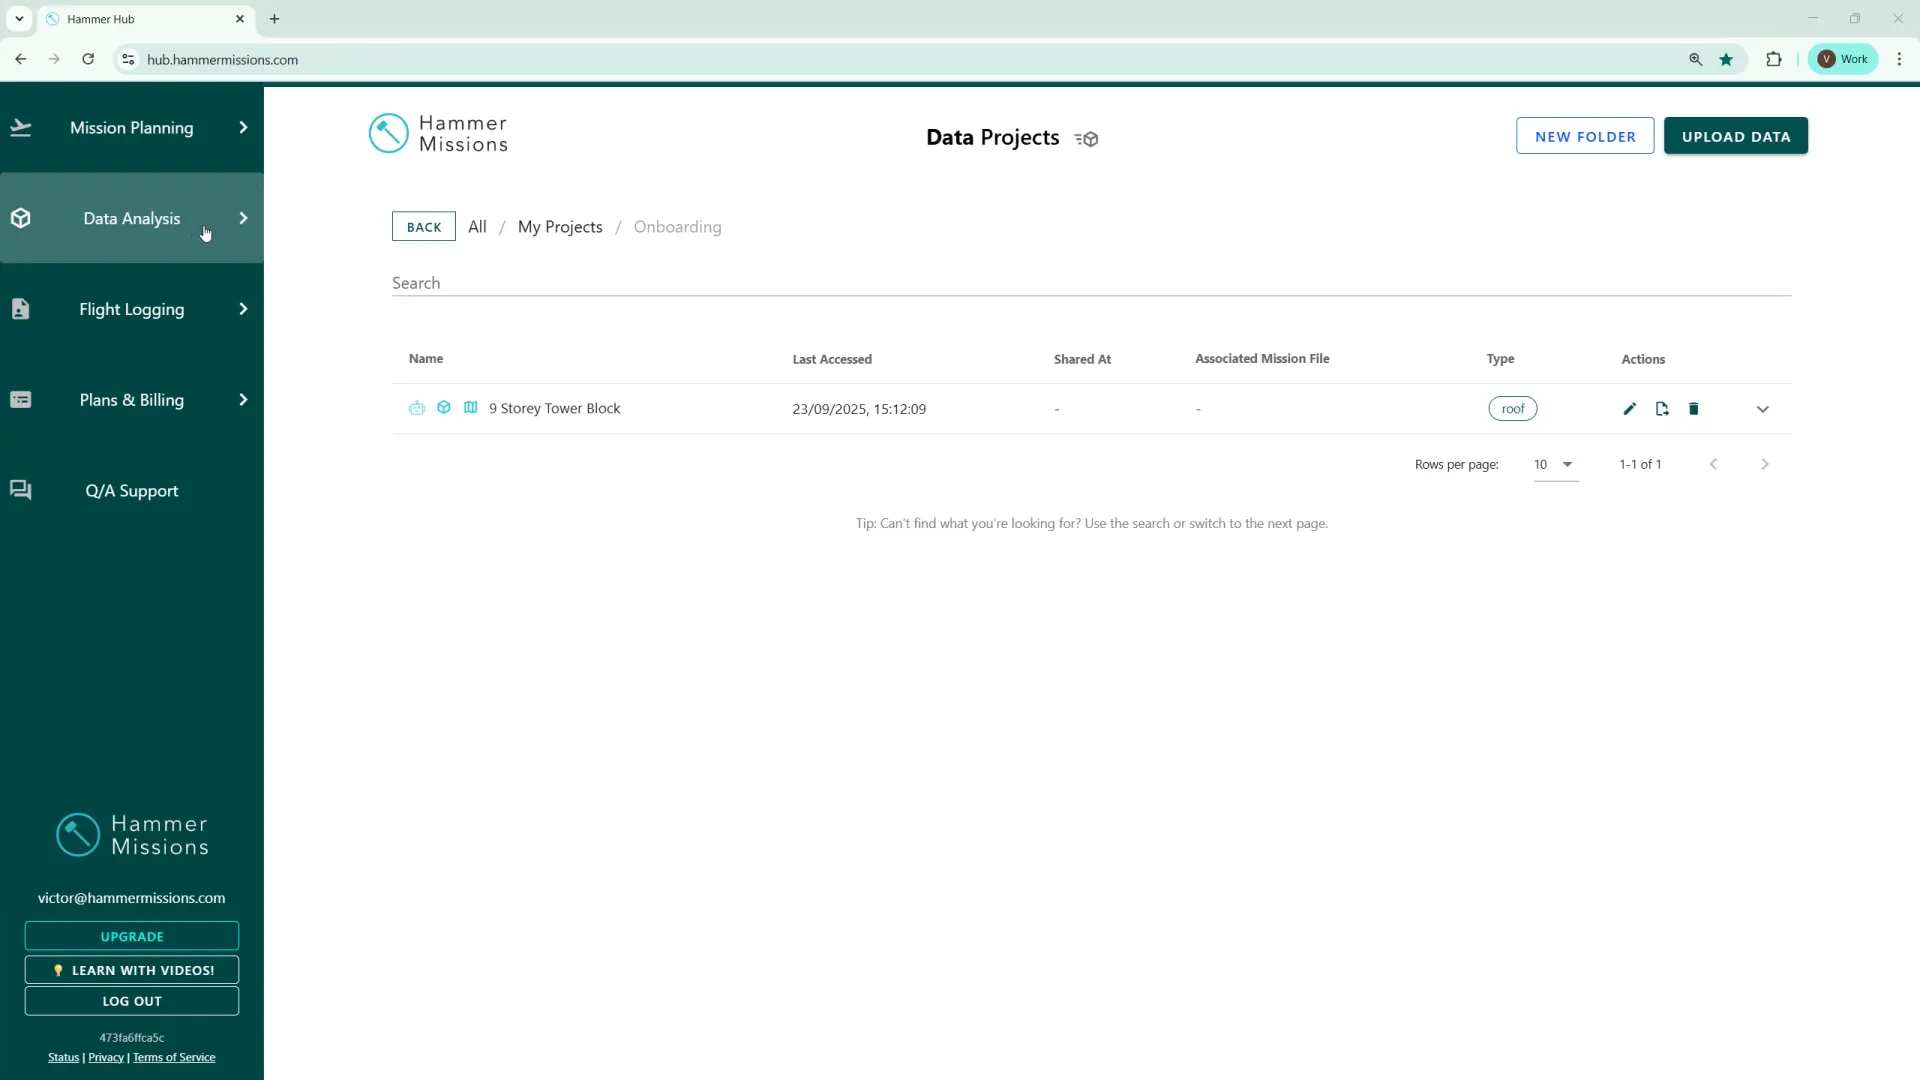
Open your project
Go to the Data Analysis section in Hammer Hub and click the project you want to generate the PDF report for.
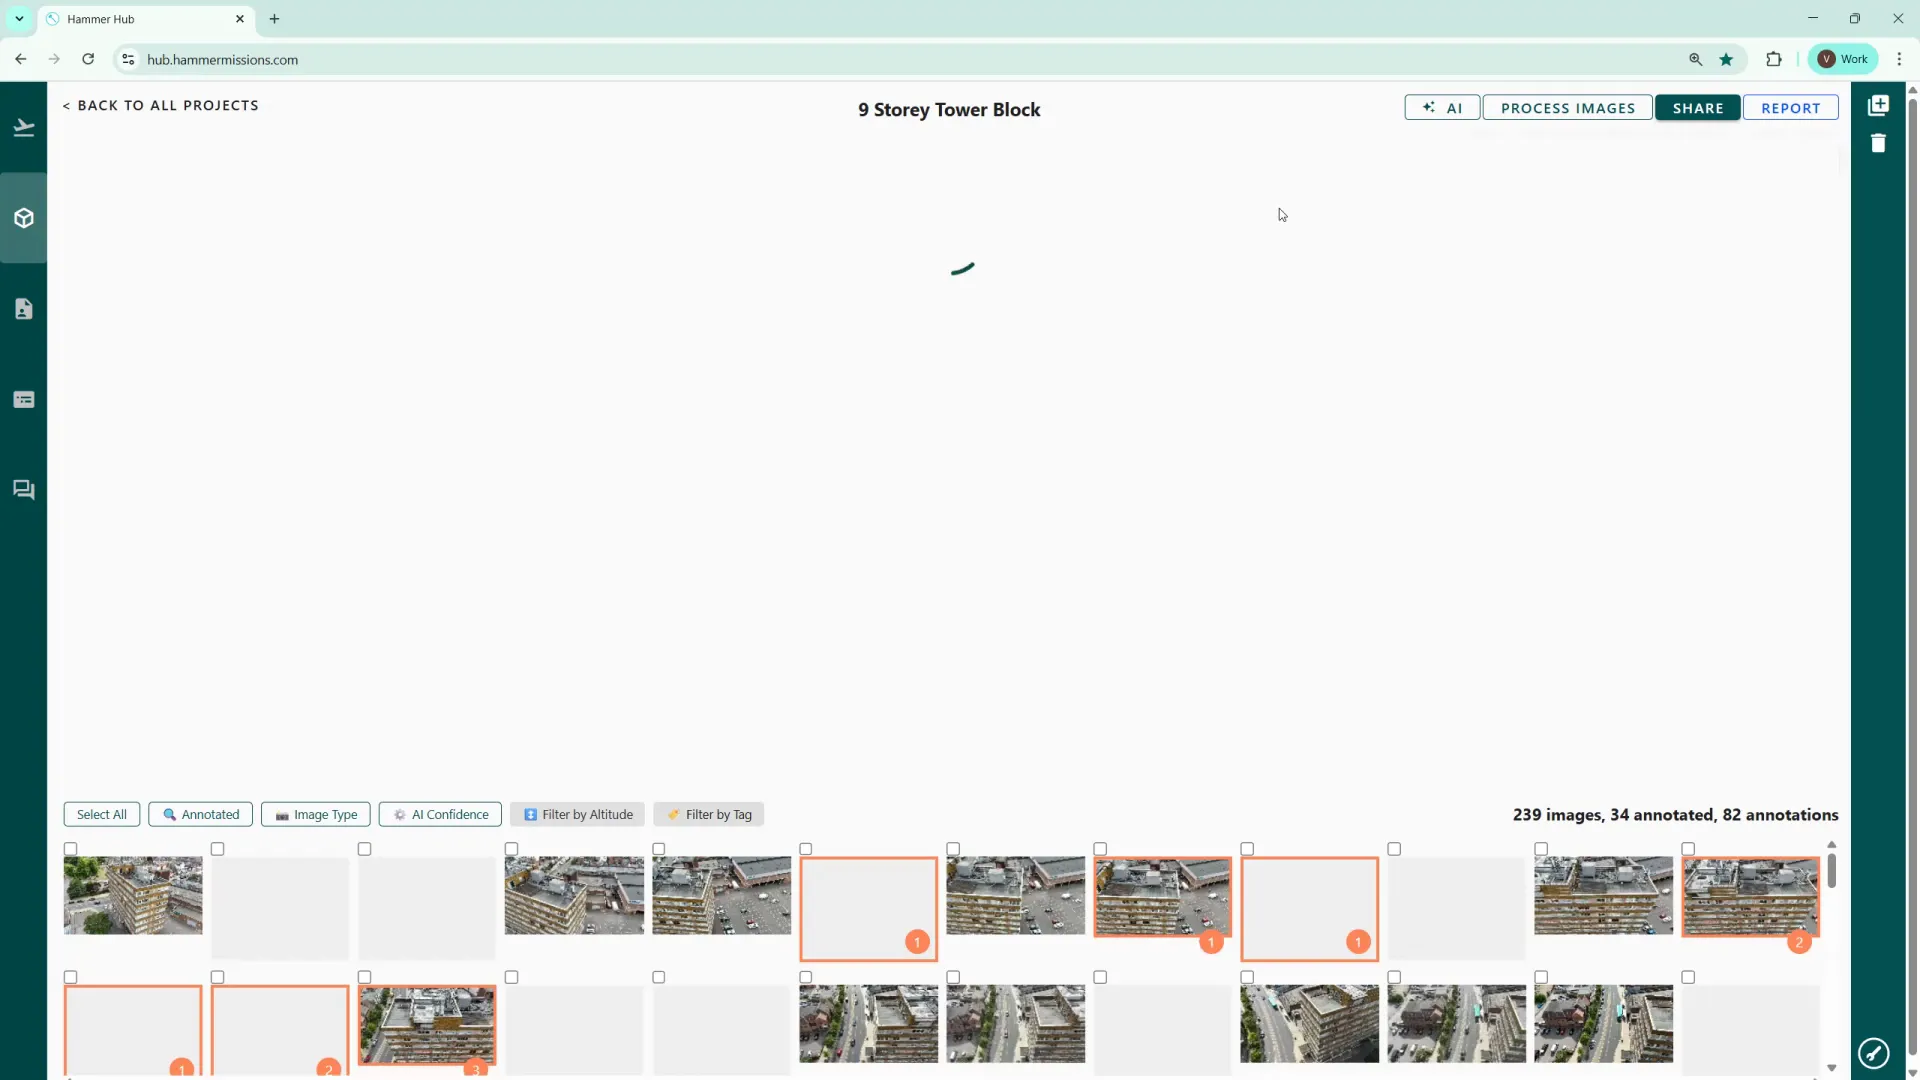
Open the Report options
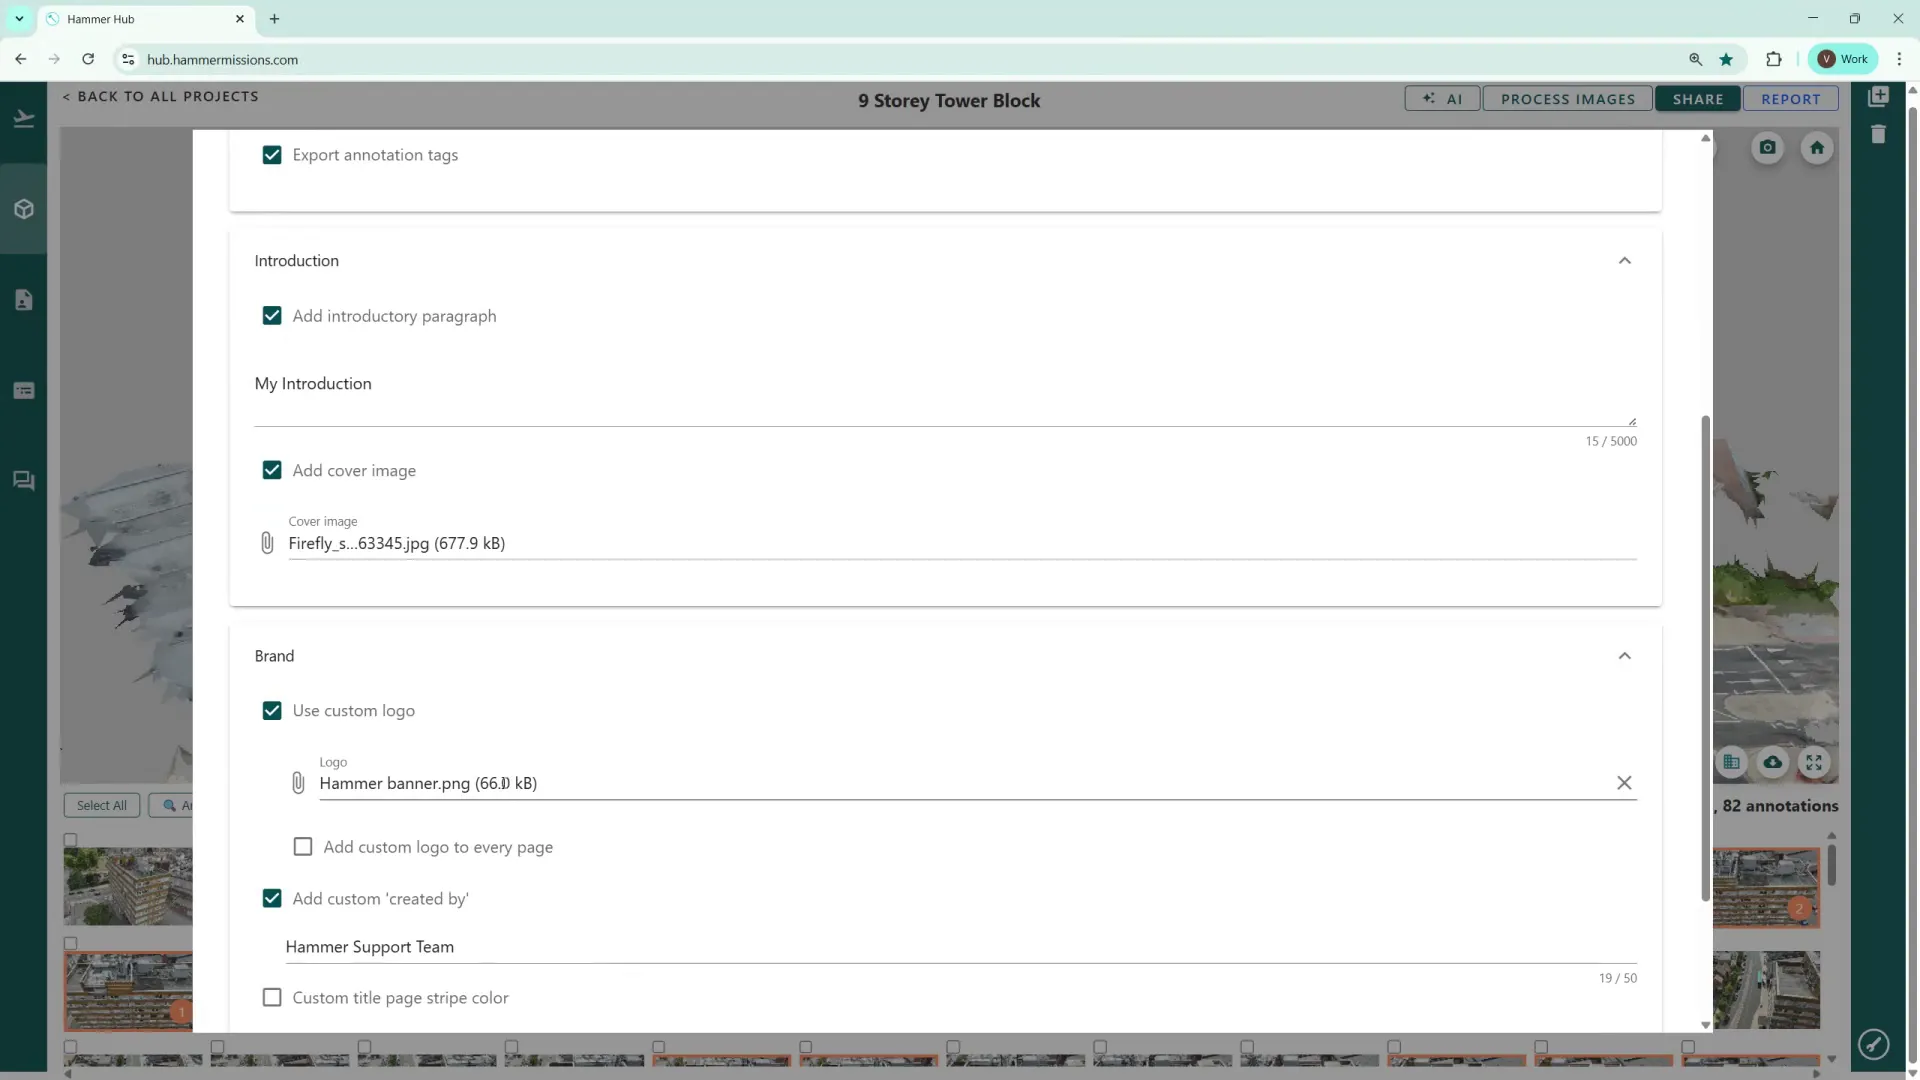
Click the Report button in the top-right. The report configuration screen which appears, provides several options so that you can tailor the final output to your needs.
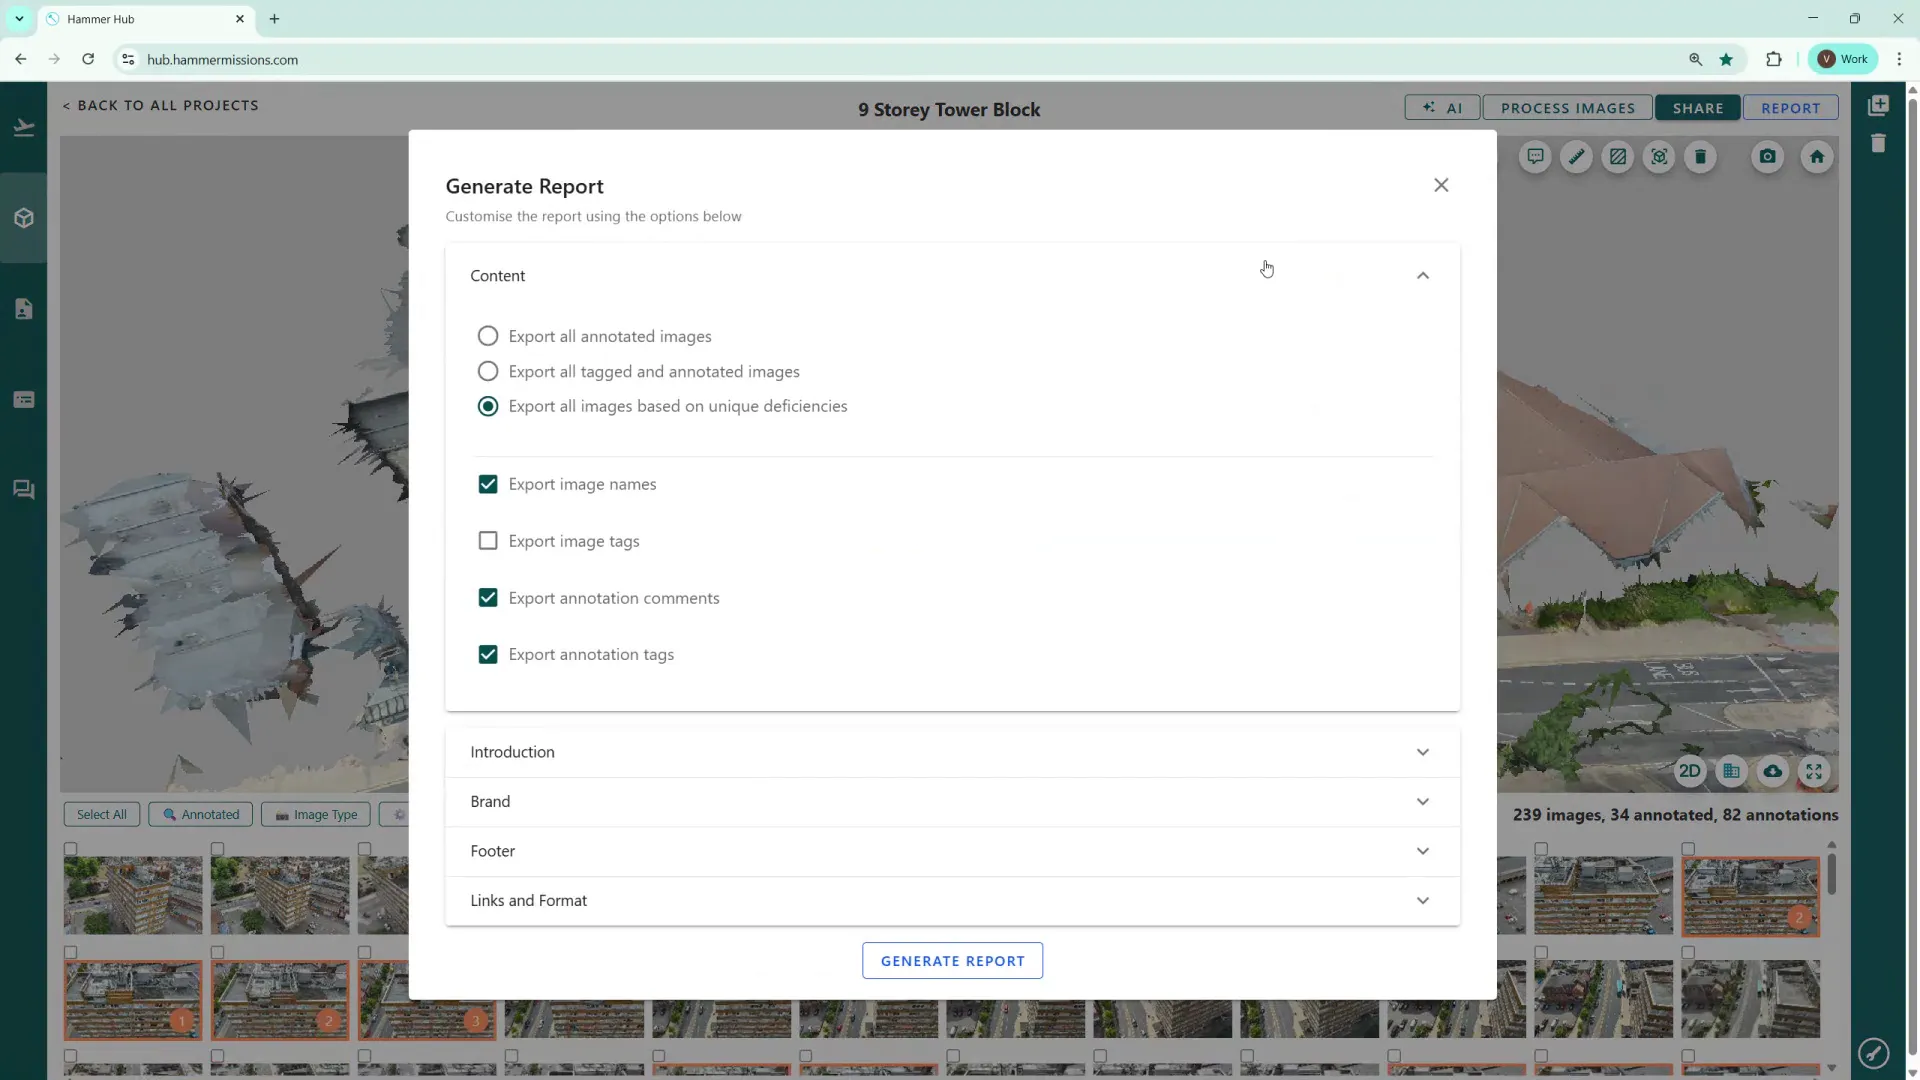
Choose what to include
Decide whether to:
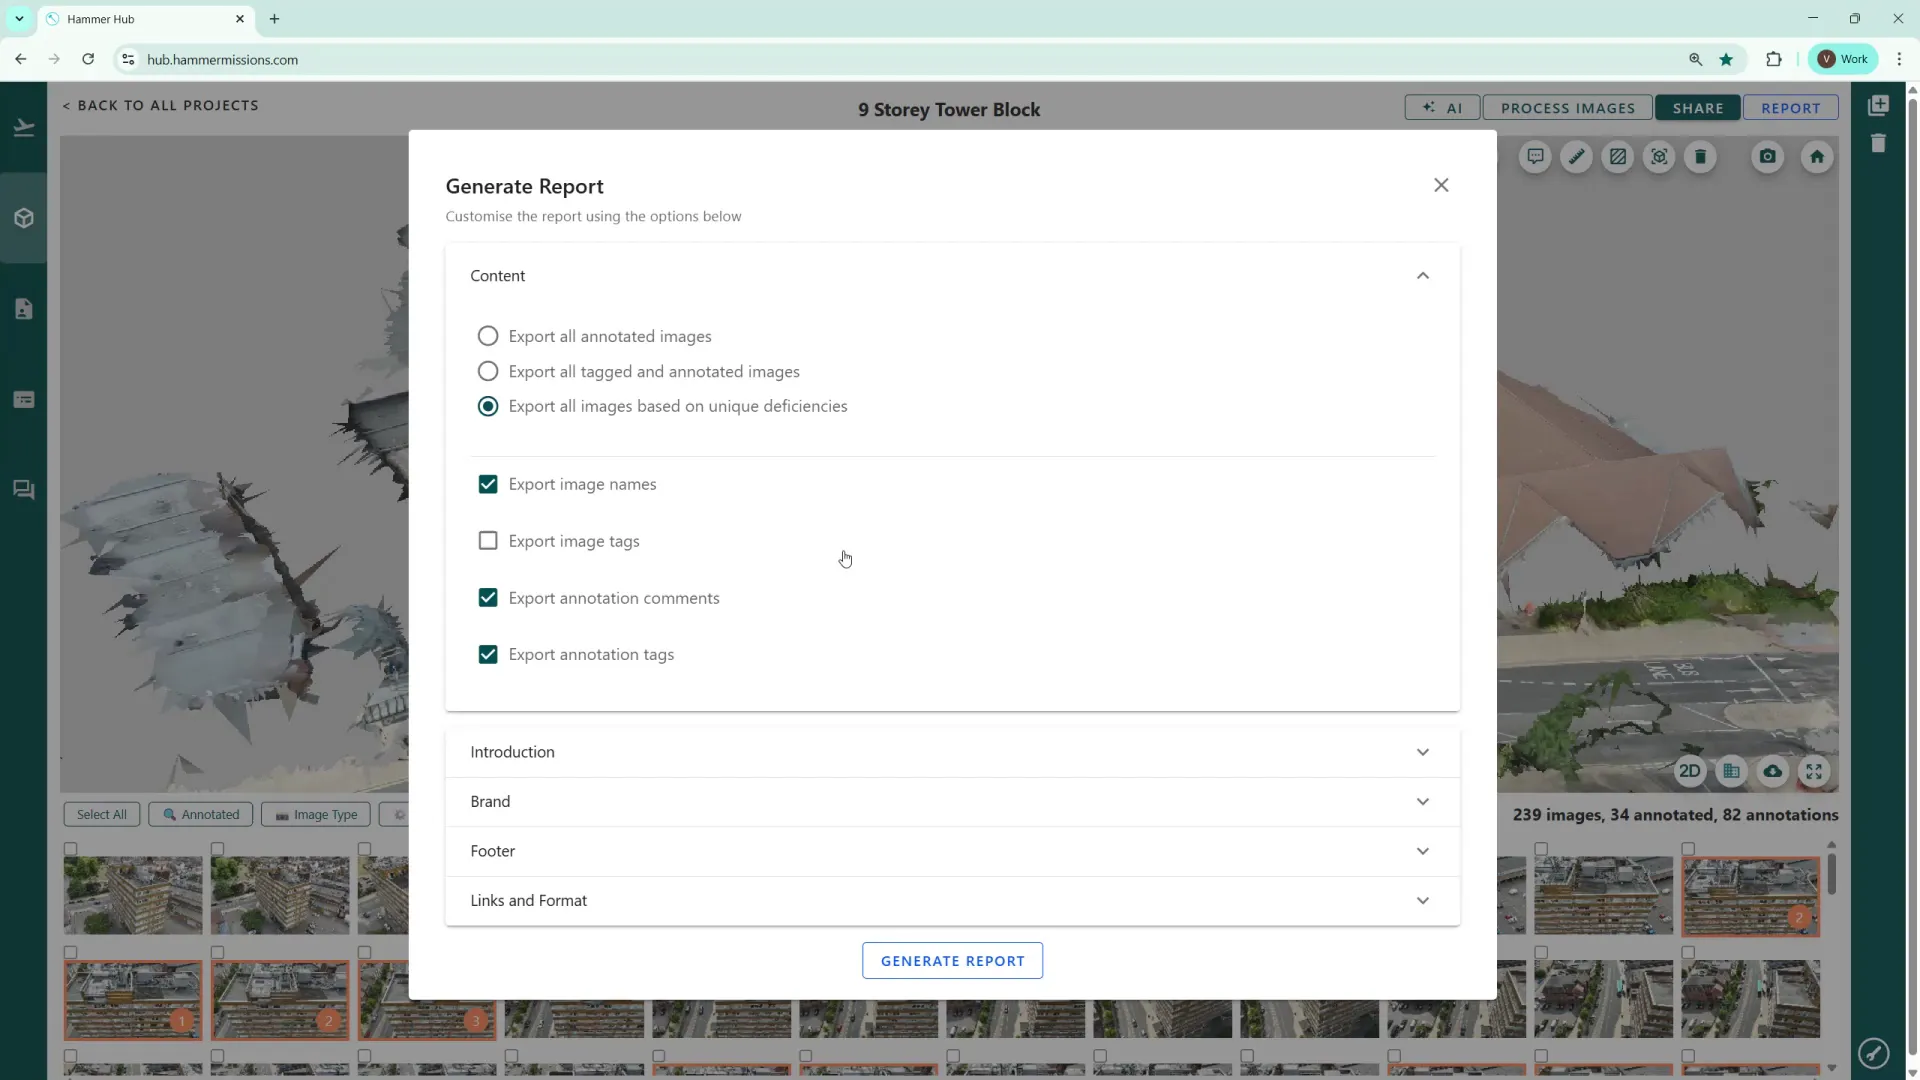
Add an introduction and cover image
Type a short introduction (optional) that will appear in the PDF and browse to select a cover image for the report.
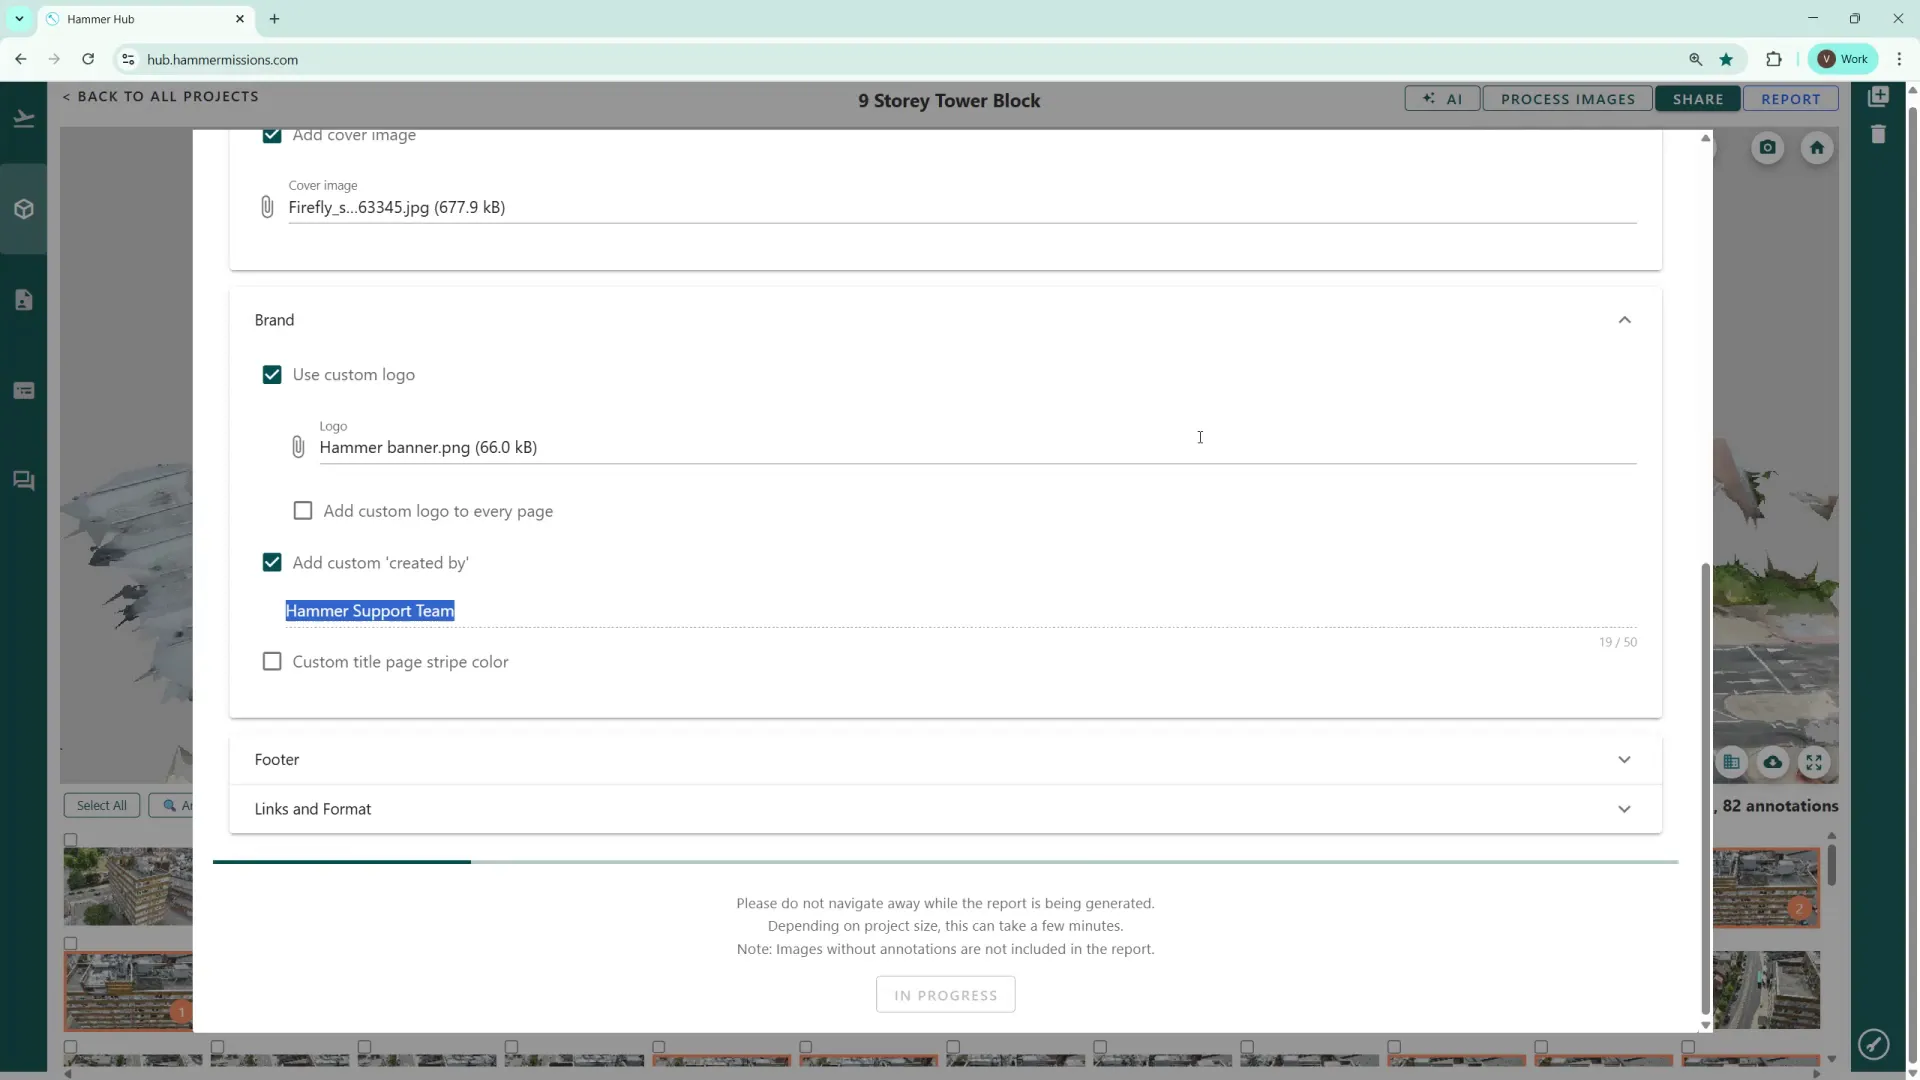
Brand the report
Optionally upload a custom logo or banner and enter the report author or team (for example, in the screenshot below we used “Hammer Support Team”).
Generate the report
Click Generate Report. The system pulls project data, annotations and images, along with any content you have supplied, then compiles them into a PDF. The process can take a few moments depending on project size and the number of annotations/images to be included.
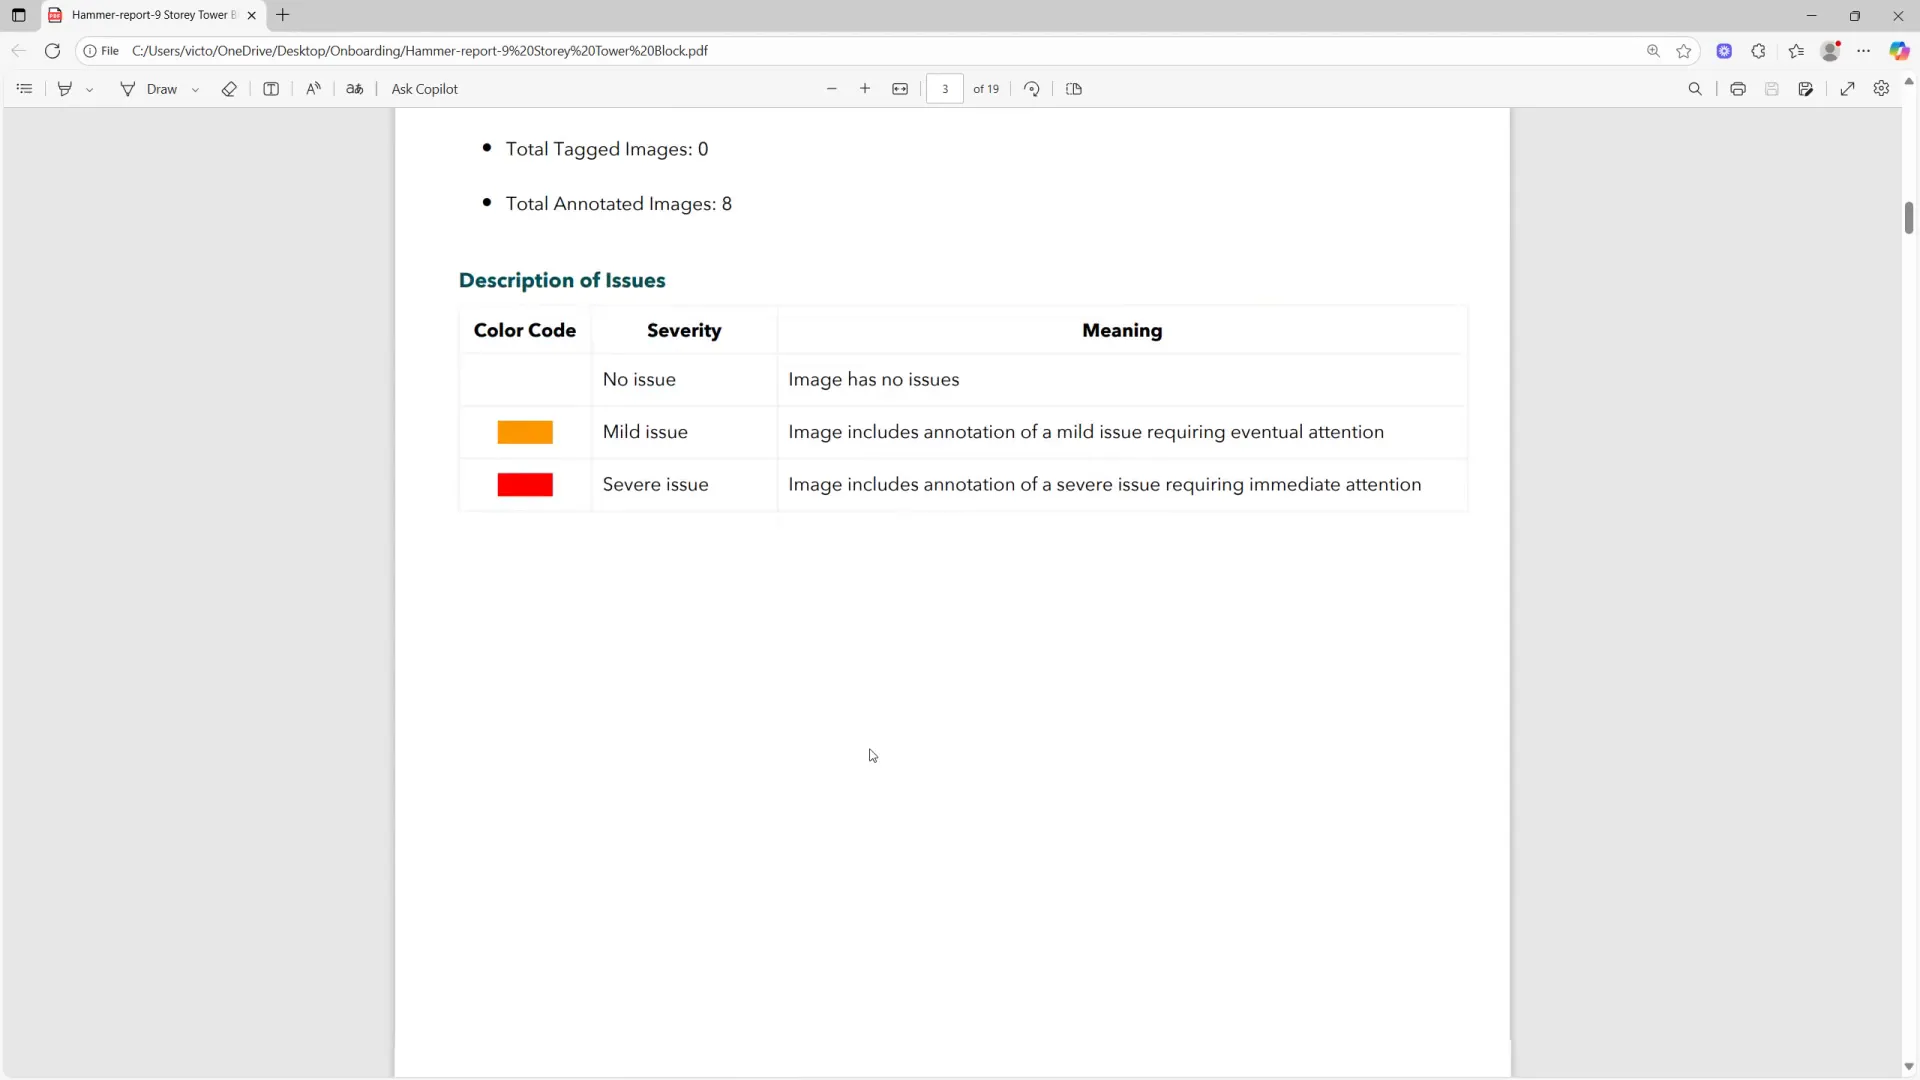
Once generated, the report provides a clear, shareable record of the inspection. Highlights include:
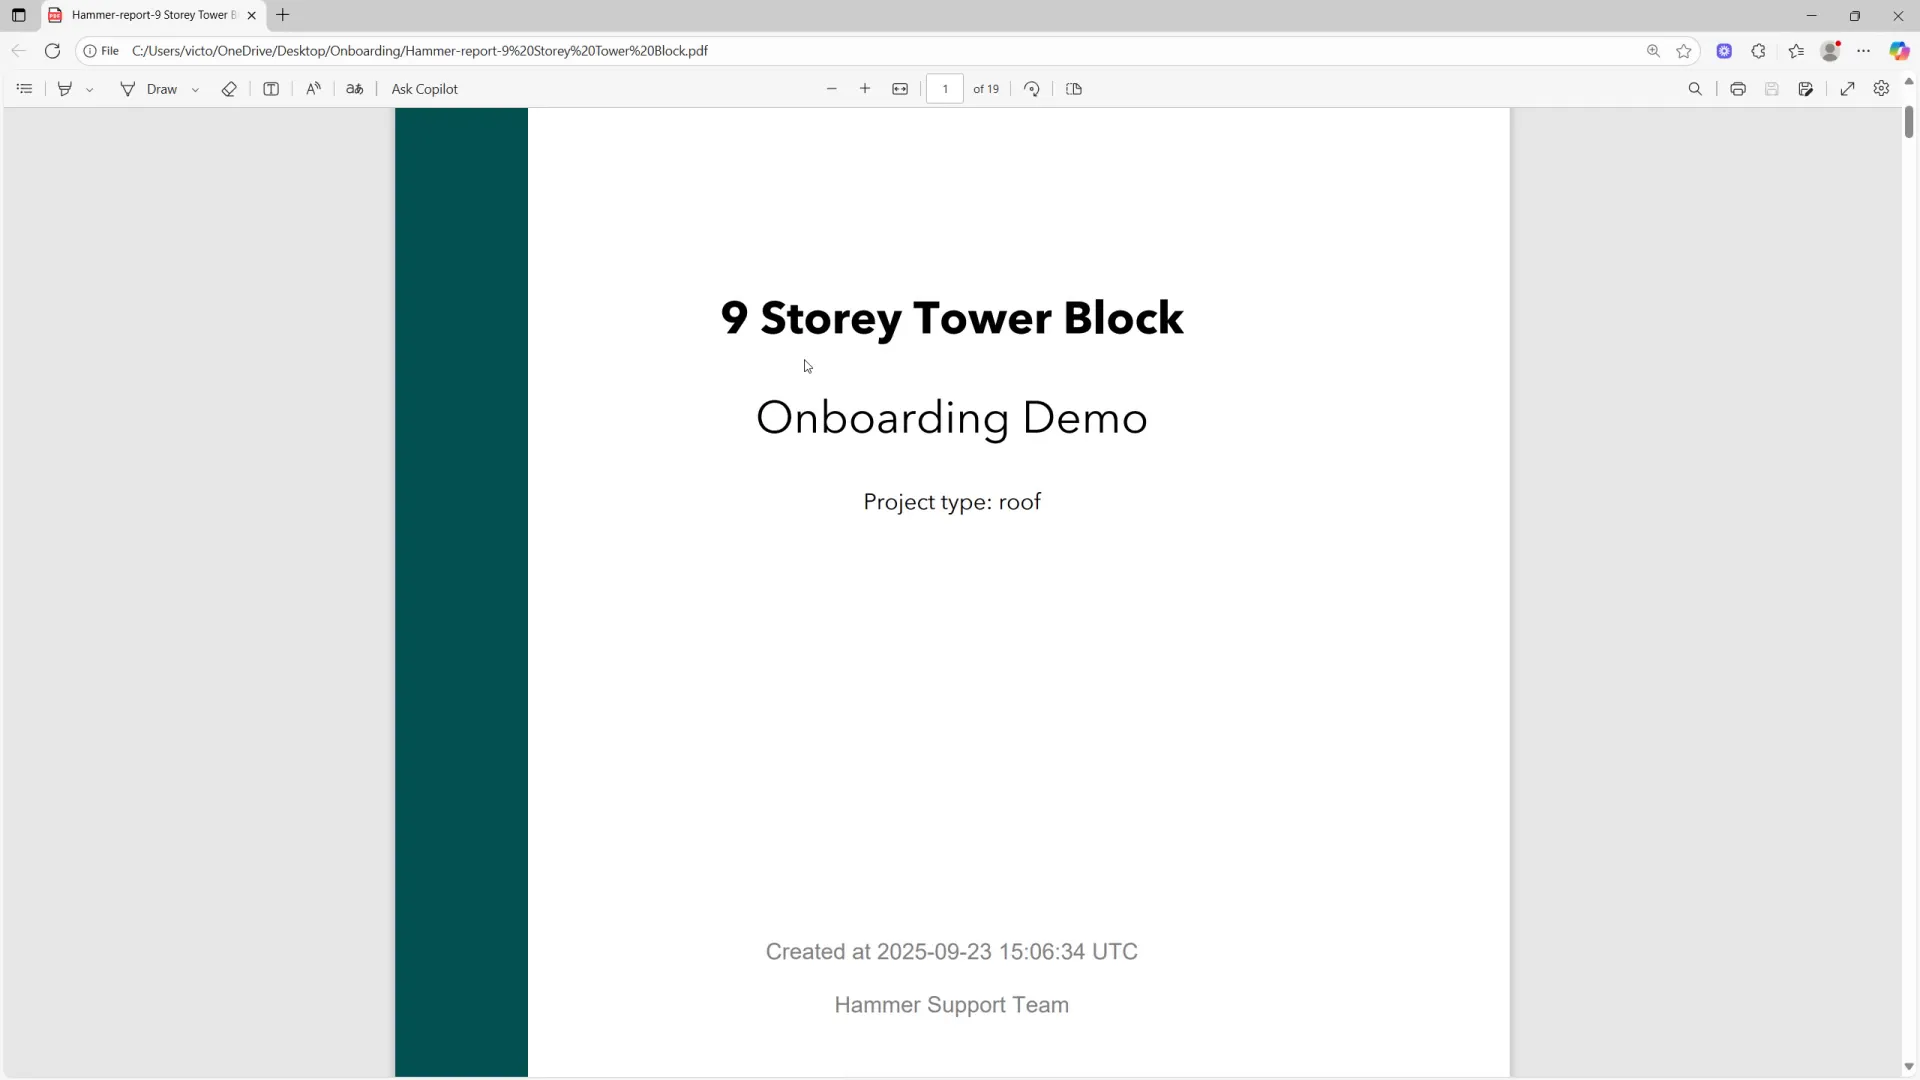
The report includes a legend that explains the colour notation used in annotations — for instance, orange to indicate general issues and red for severe issues — alongside quick statistics about images and annotations so recipients immediately understand the scope.
A dedicated table summarises deficiency counts and totals for the whole project, which is useful for high-level reporting or handing off to stakeholders for planning and budgeting.
Deficiency quantification table with totals for the project
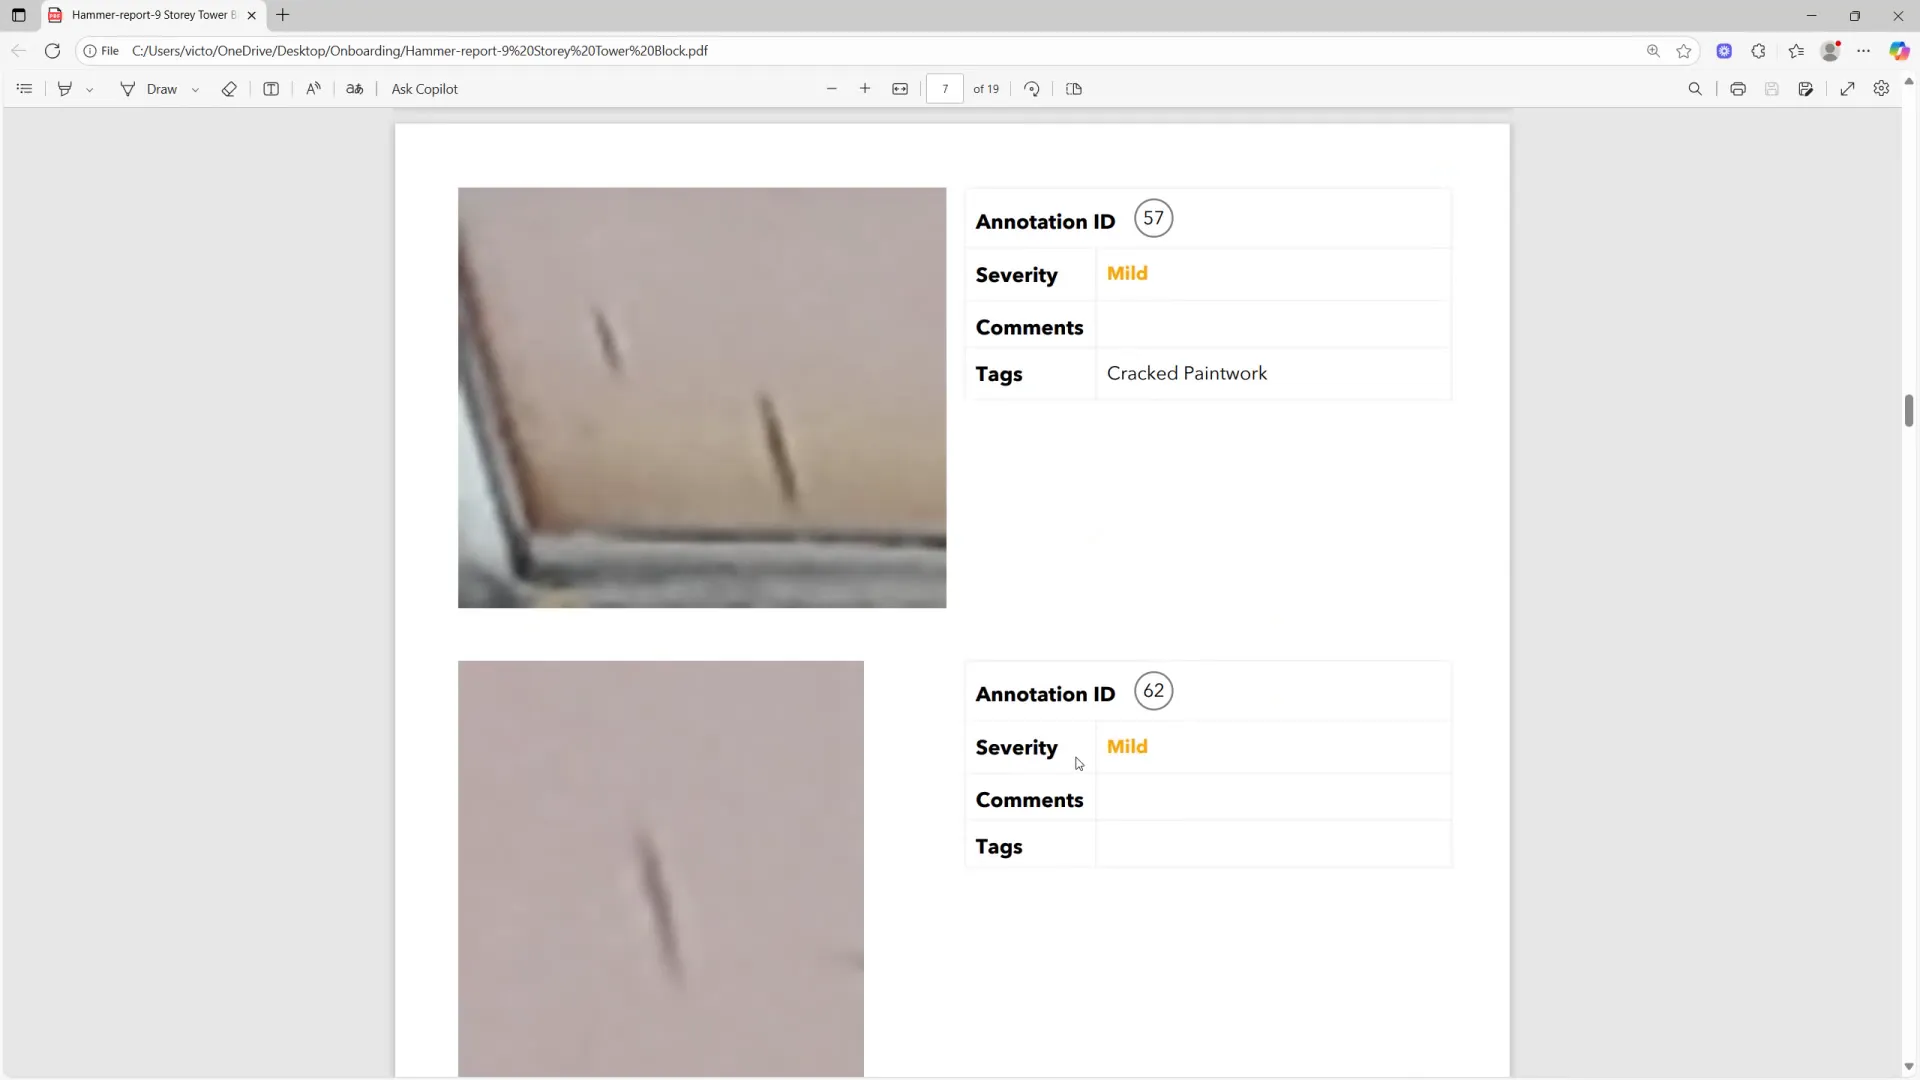
The PDF contains numbered links to annotated elements discovered during analysis. Clicking a link takes you directly to the image with the highlighted defect and its surrounding context. Further down the report you'll find close-up images for each deficiency, making it easy for clients to see the exact issue.
Generating a professional, data-rich PDF from the Hammer Missions platform is quick and straightforward. The report consolidates annotated images, severity coding, quantified deficits and direct links into a single document you can share with confidence. Try the options to tailor each report to your audience and workflow — it makes handing off inspection results much easier.
We hope this guide helps you streamline sharing inspection data with customers, clients and other interested parties.
Exporting Models from Hammer Missions - BIM & CAD ready outputs