
Workflows, Best Practice guidance, Tips and Tricks to extract the best from Hammer Missions
In this guide we will walk you through how you can use the AI model functionality, in the Hammer Missions platform to find deficiencies across a project. We will show you the entire workflow; from selection of the AI model, running it against your project, right through to quantifying the results which can then be exported for further analysis and/or reporting.
If you prefer to watch a video on this topic use the link immediately below, otherwise skip over it to the Blog article
https://www.loom.com/share/fc0255e540af44d488e80c8020f0ac20?sid=6965901c-59d7-40d1-8293-4cfc8864970a
The goal is simple: use our trained AI model feature, to scan every image in a project, locate defects of interest, then quantify and present those results in a structured way so you can review, analyse and share or export the data.
Before running the AI model, make sure you have:
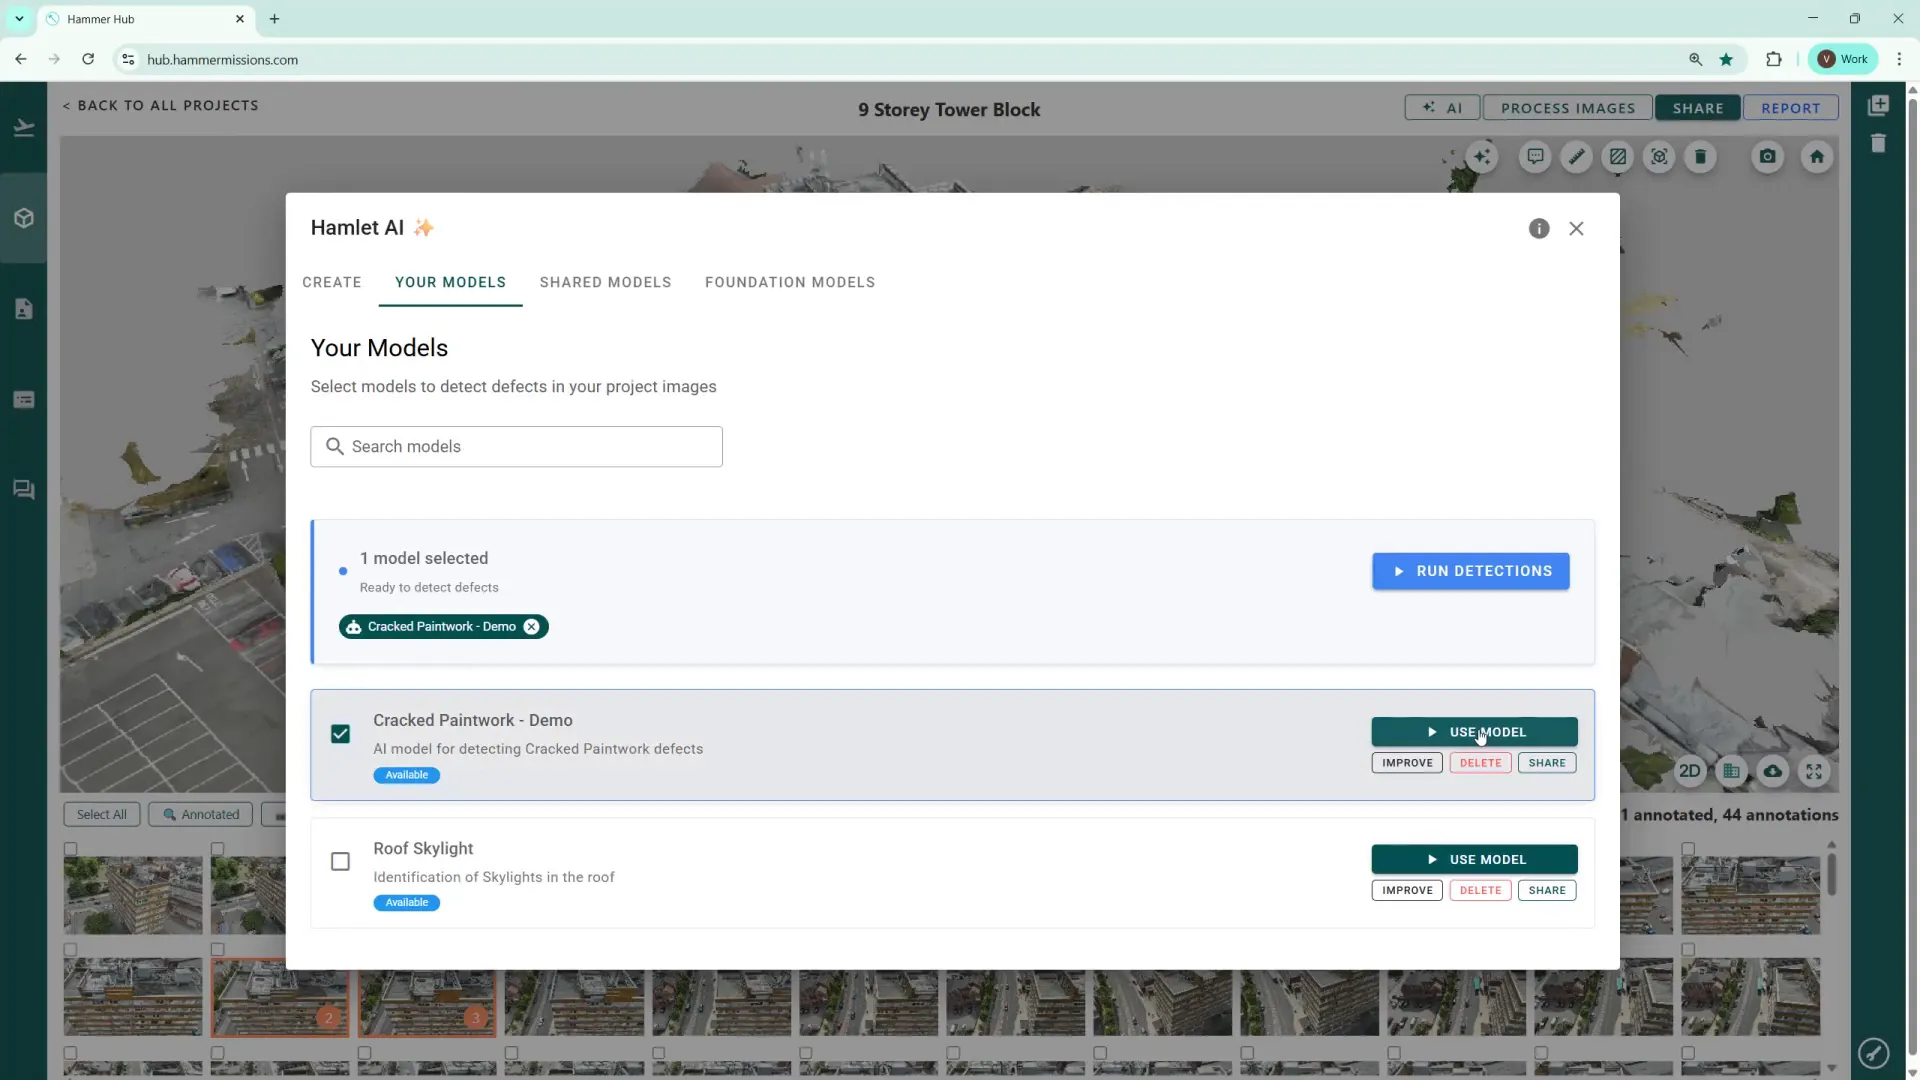
To run your AI model, from within your project, open the AI section (top right side of screen) and go to "Your Models". Select the AI model(s) you want to use and hit the blue "Run Detections" button to start the analysis of your project. The system will scan all images in the project, to locate matches according to the AI model's criteria.
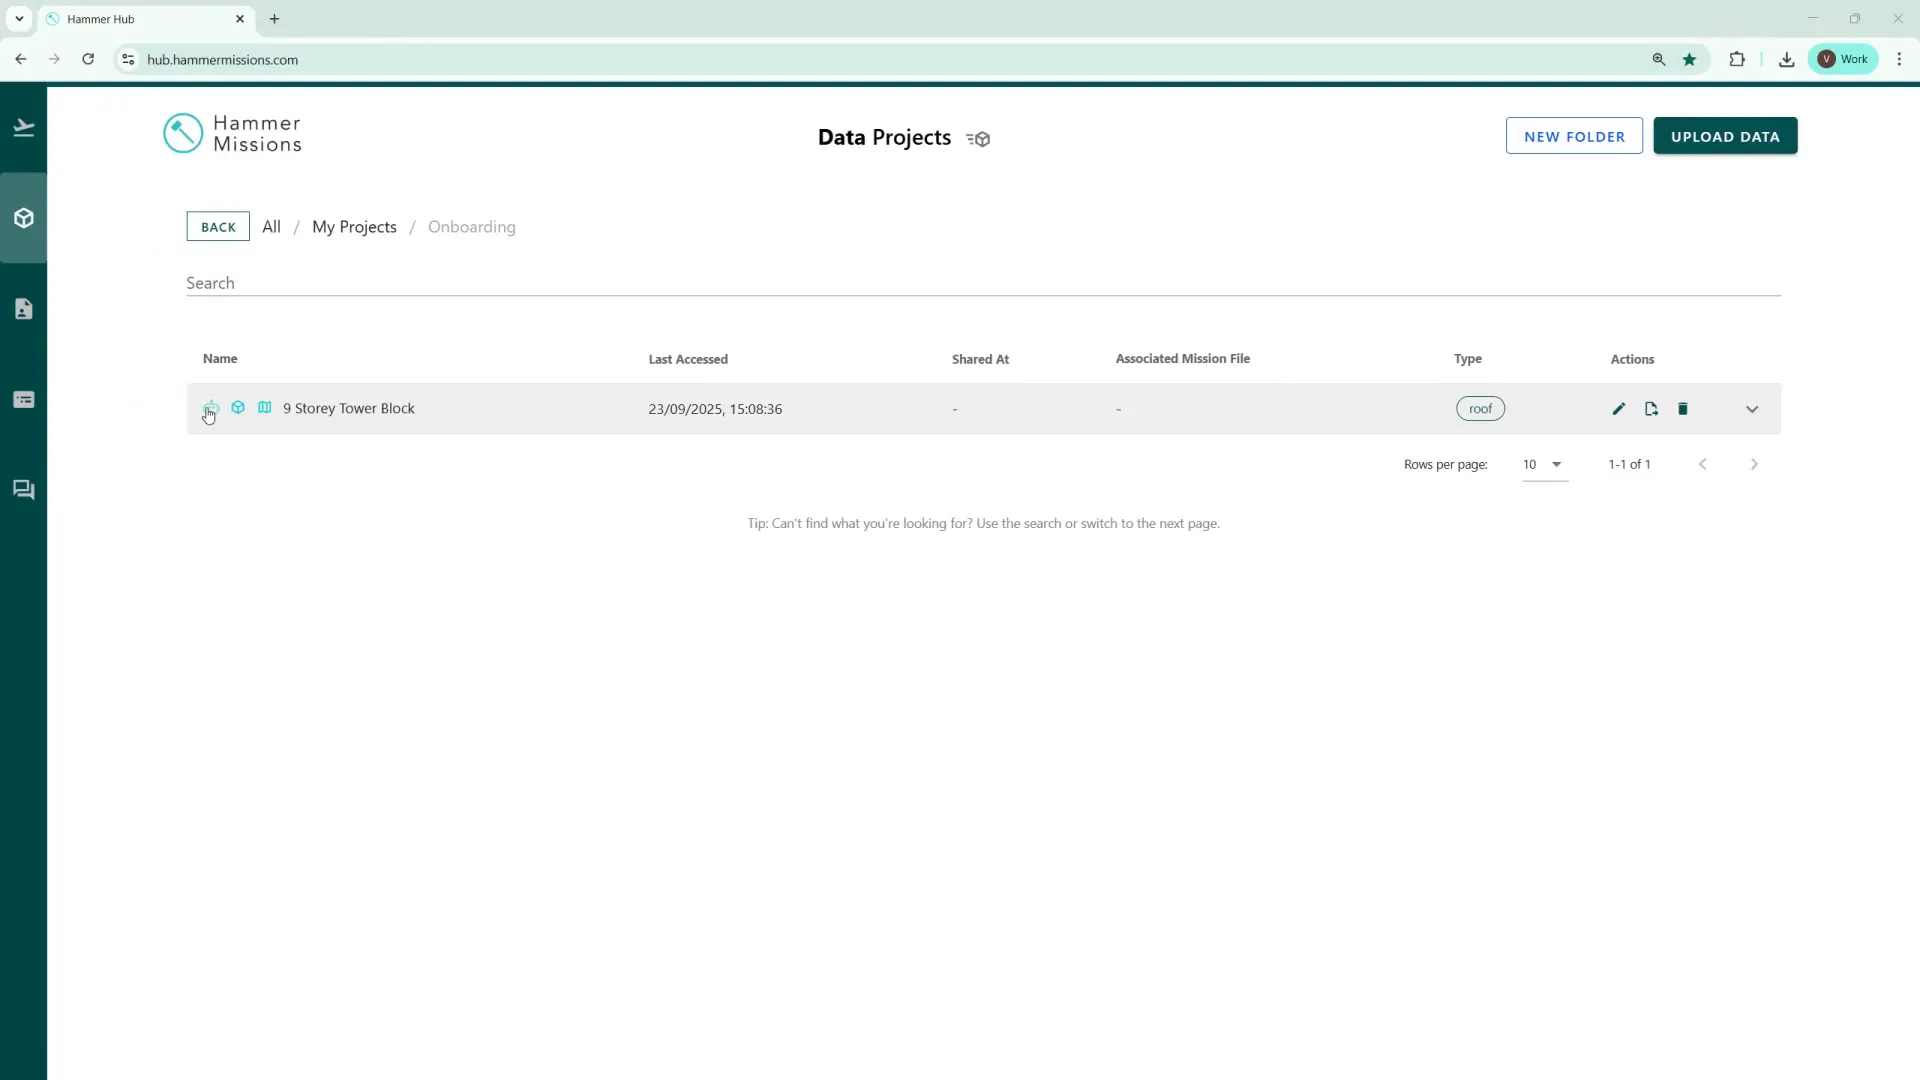
You will receive a notification email when the AI model run completes. Also on the project list screen in Hammer Hub, a robot icon appears next to projects where an AI run has been completed, giving you a quick visual cue that the analysis has been conducted.
After the AI model run finishes, additional images that contain detected defects will be tagged. In our example the AI model found a further 23 images beyond the 11, that had originally been annotated.

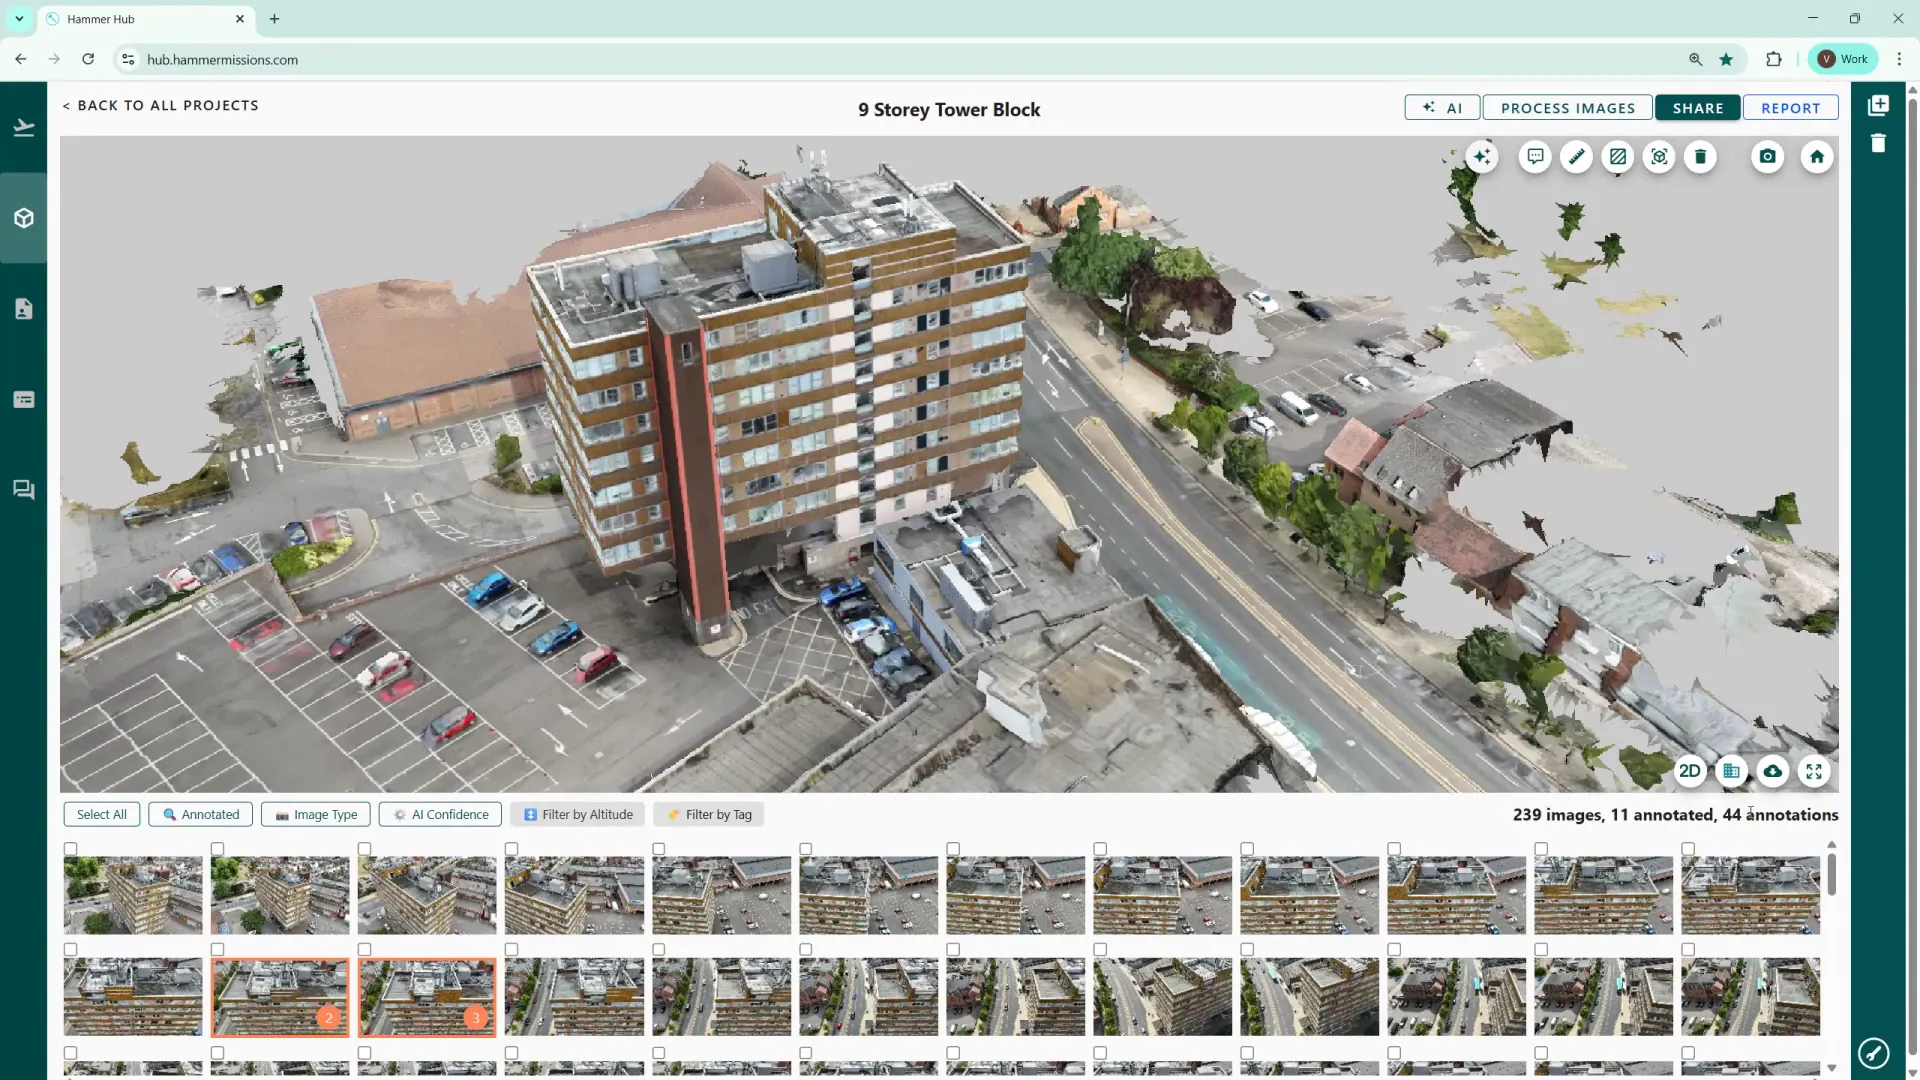
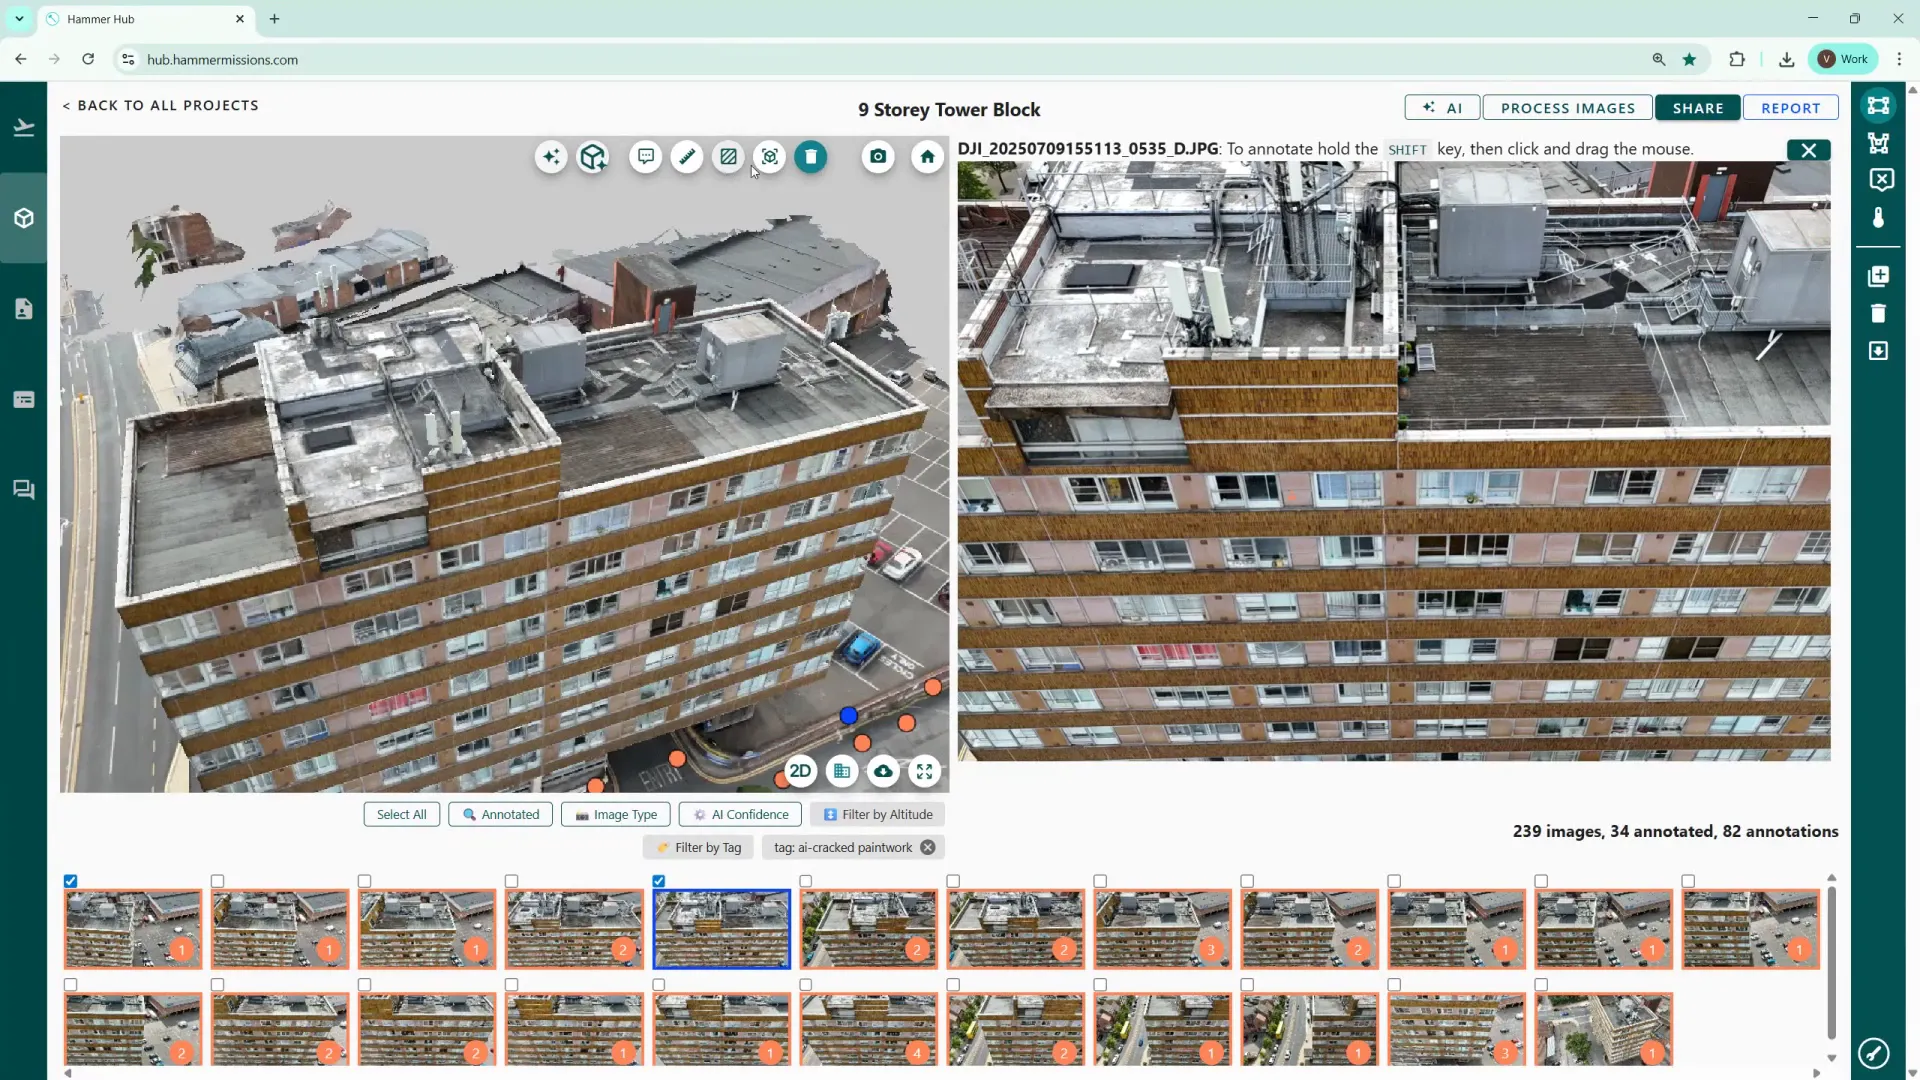
Use the "Filter by tag" function, to display thumbnails of AI tagged items (the tag name will have an "AI-" prefix). The thumbnails will show an orange circle with a number — this indicates how many hits (detections) the AI model has made in that specific image.
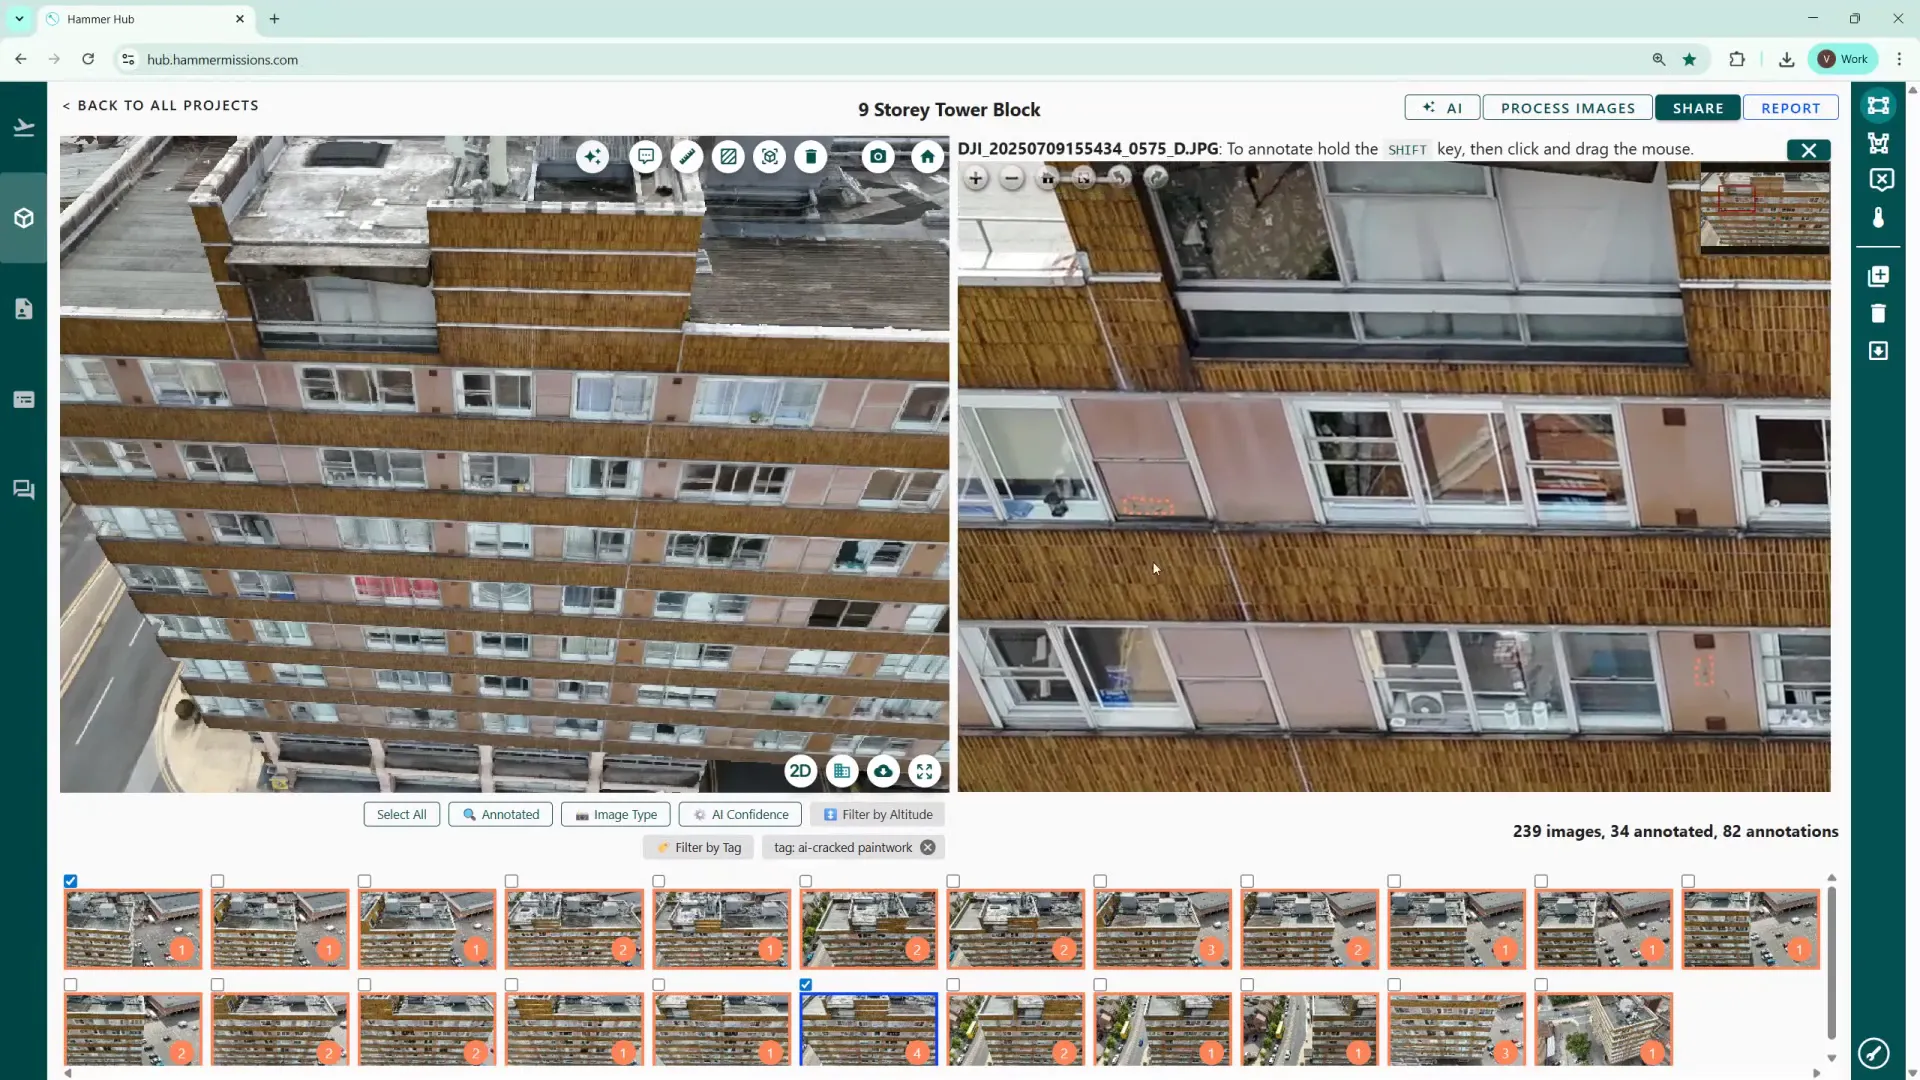
AI detections are shown with a dotted orange border around the detected areas. (Manually detected/annotated detections use a solid boundary), making it easy to distinguish machine detections from human annotations.
The AI confidence slider changes the detection threshold. Lower the threshold (towards zero) to show more potential detections (higher recall), or raise it to be more stringent and reduce false positives (higher precision).
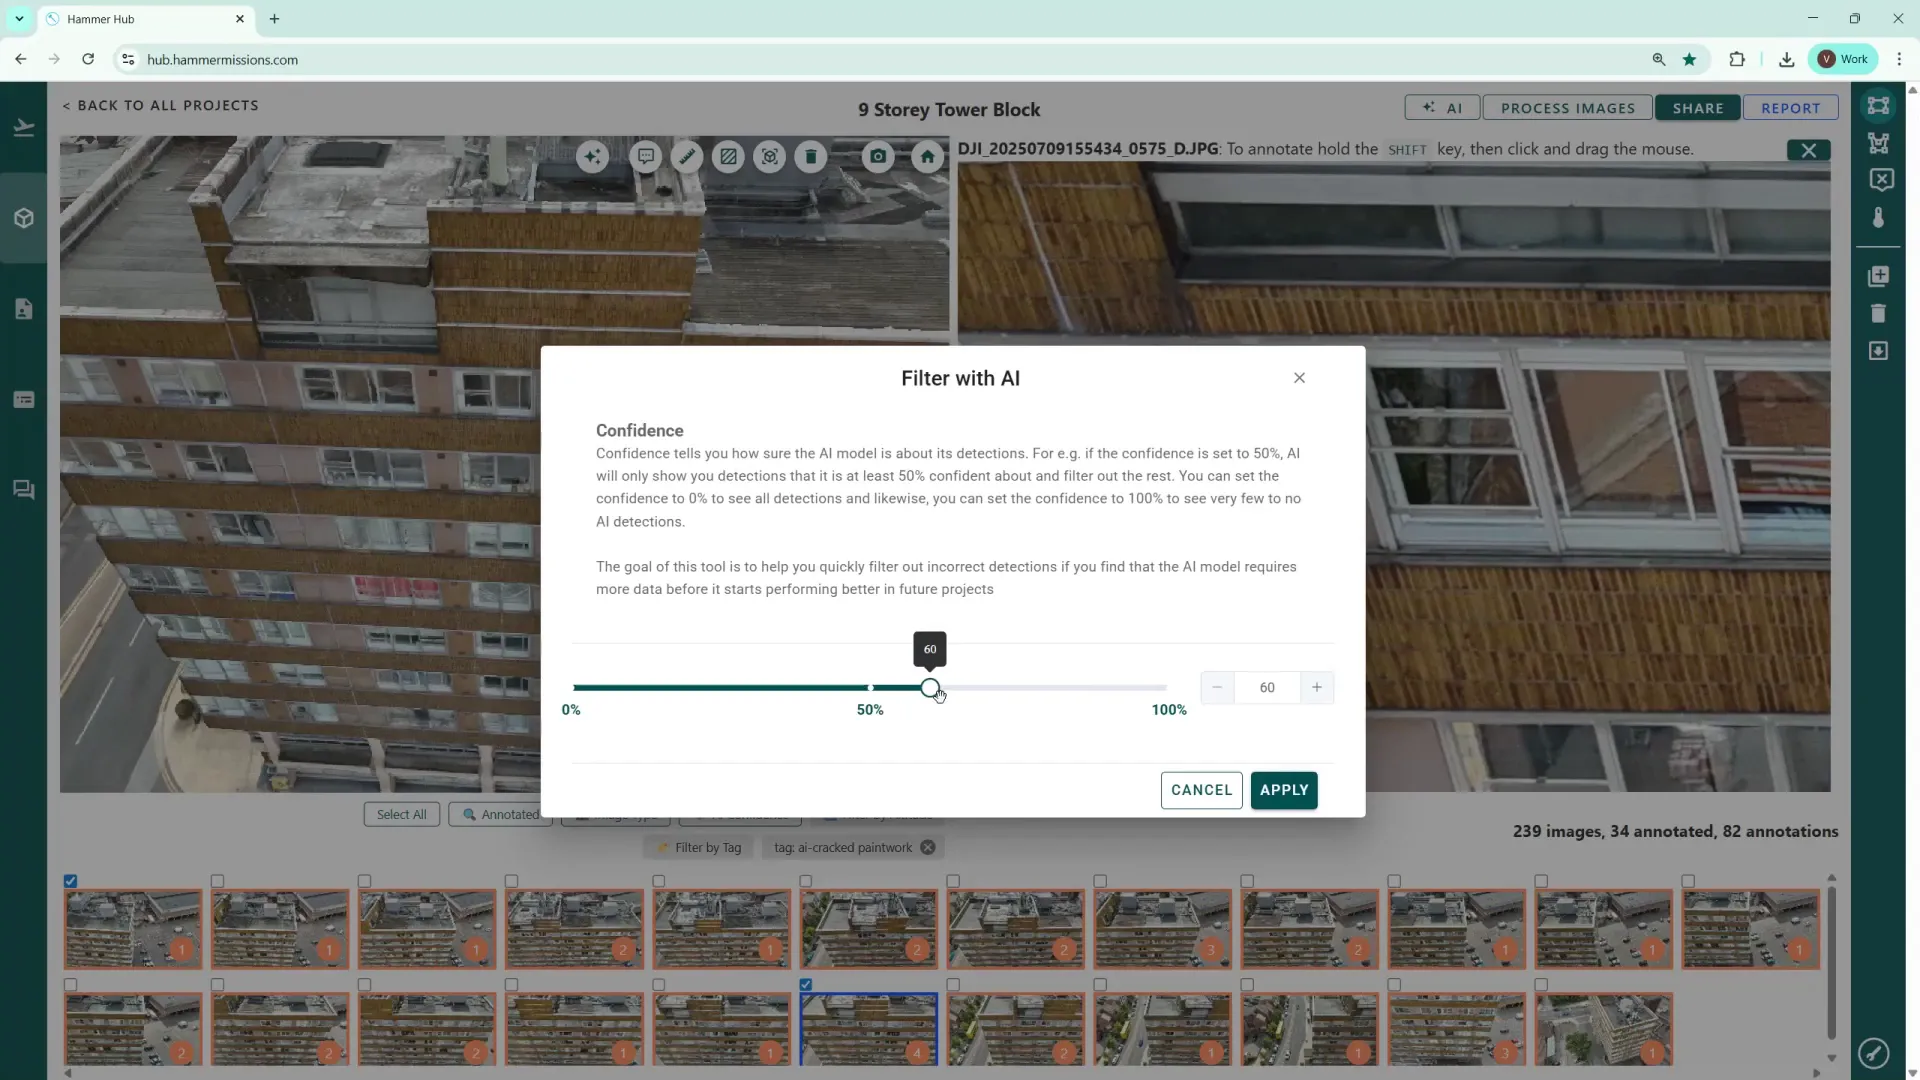
Adjust this while reviewing results so you can find a balance that suits your use case: broader detection for preliminary surveys or tighter detection for verified reports.
Once you have model results, use the AI quantification function (3 starts in a white circle - top/left side of screen) to scan the entire project and produce a table showing how many deficiencies were found across your project and whether they originated from human annotation or the AI. The process can take a couple of minutes depending on project size.
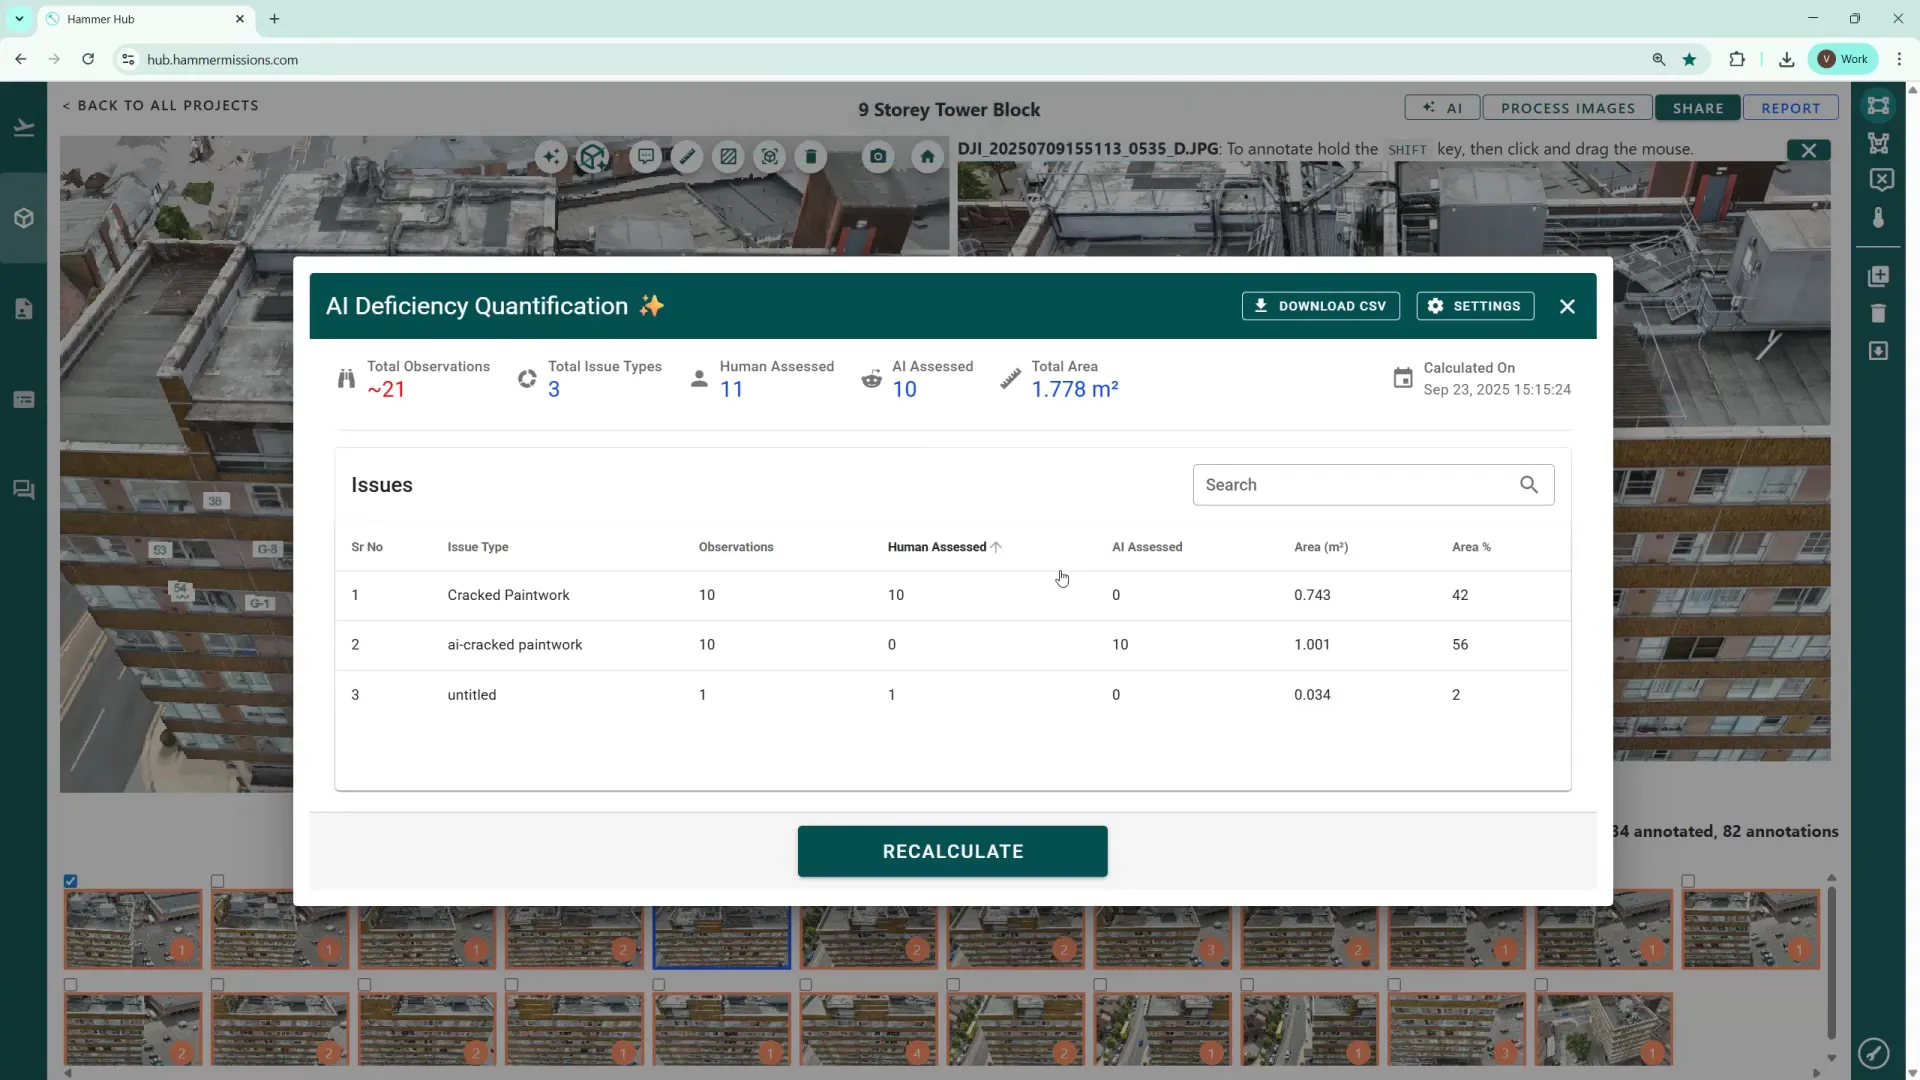
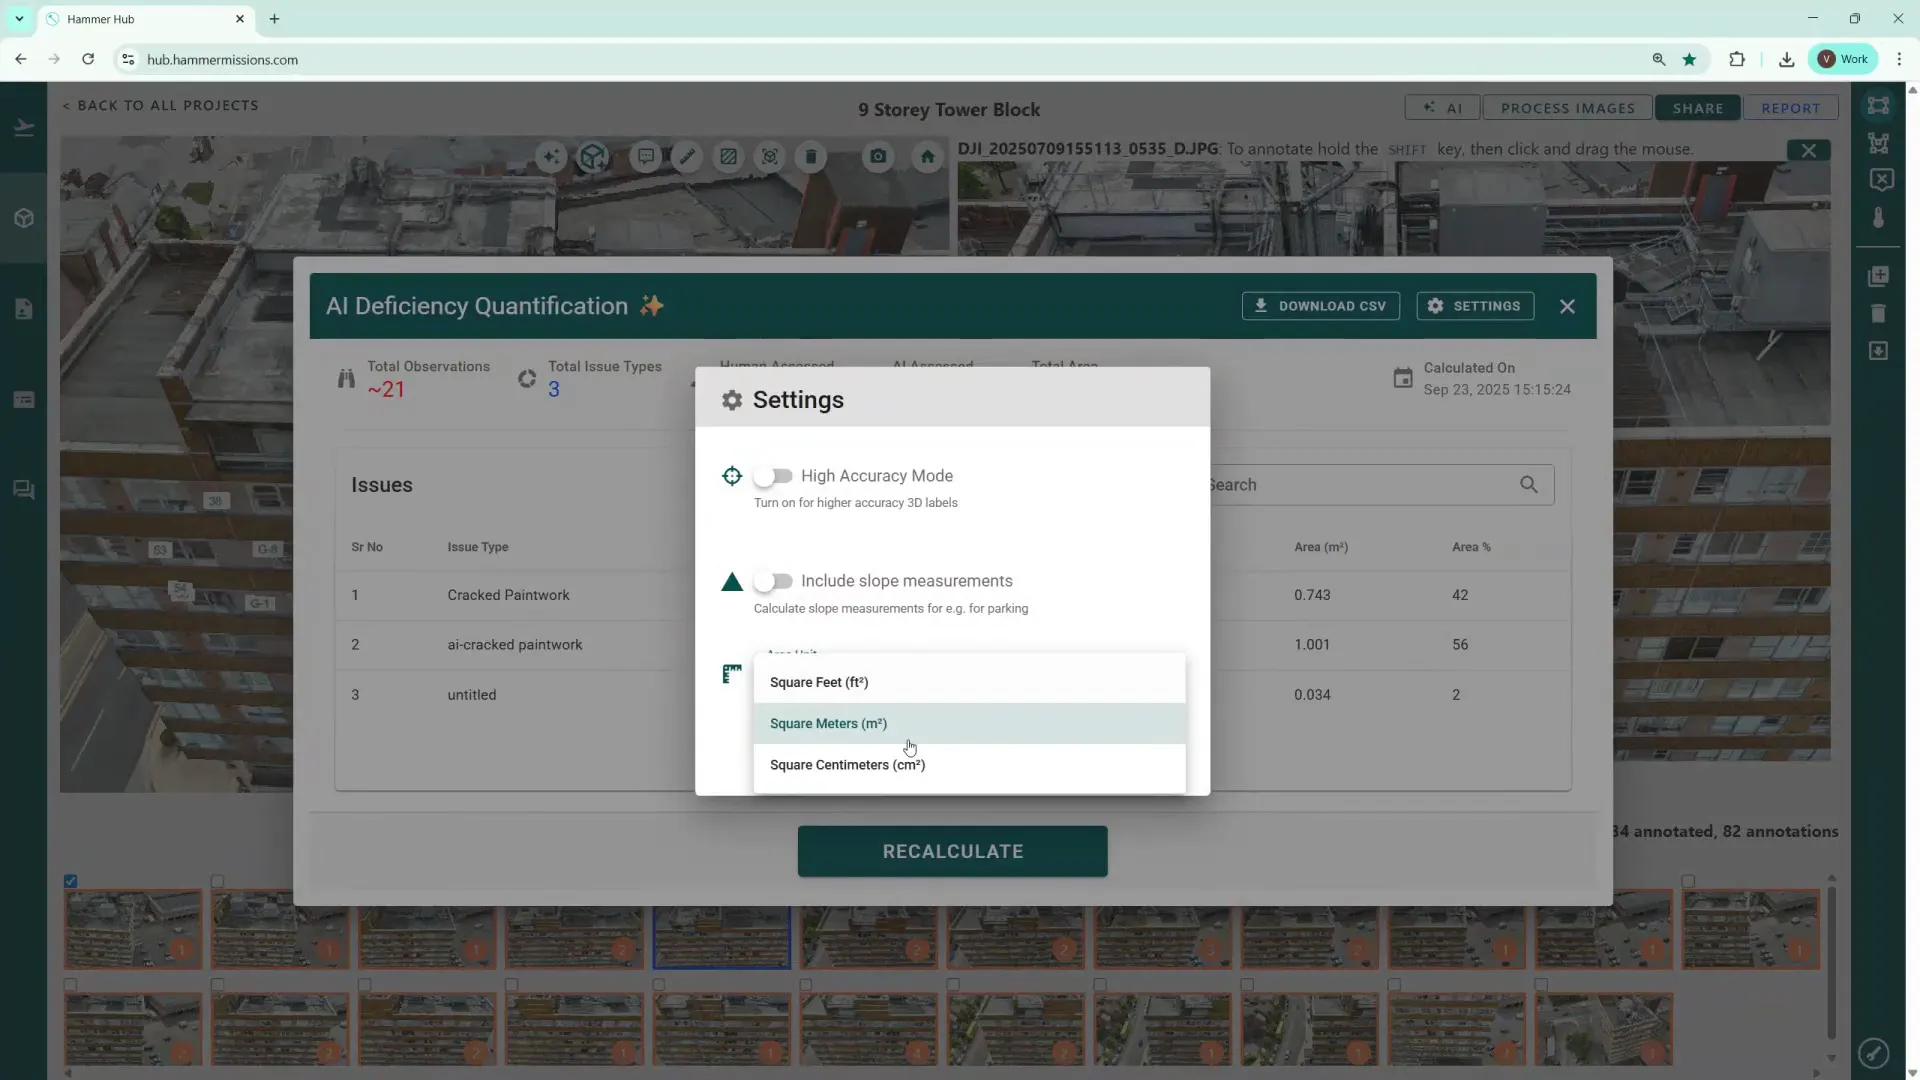
The quantification output can be downloaded as a CSV output, so that you can incorporate the data into your own reports. In the settings option, you can change units (for example, switch measurements from square metres to square feet) to suit reporting needs.
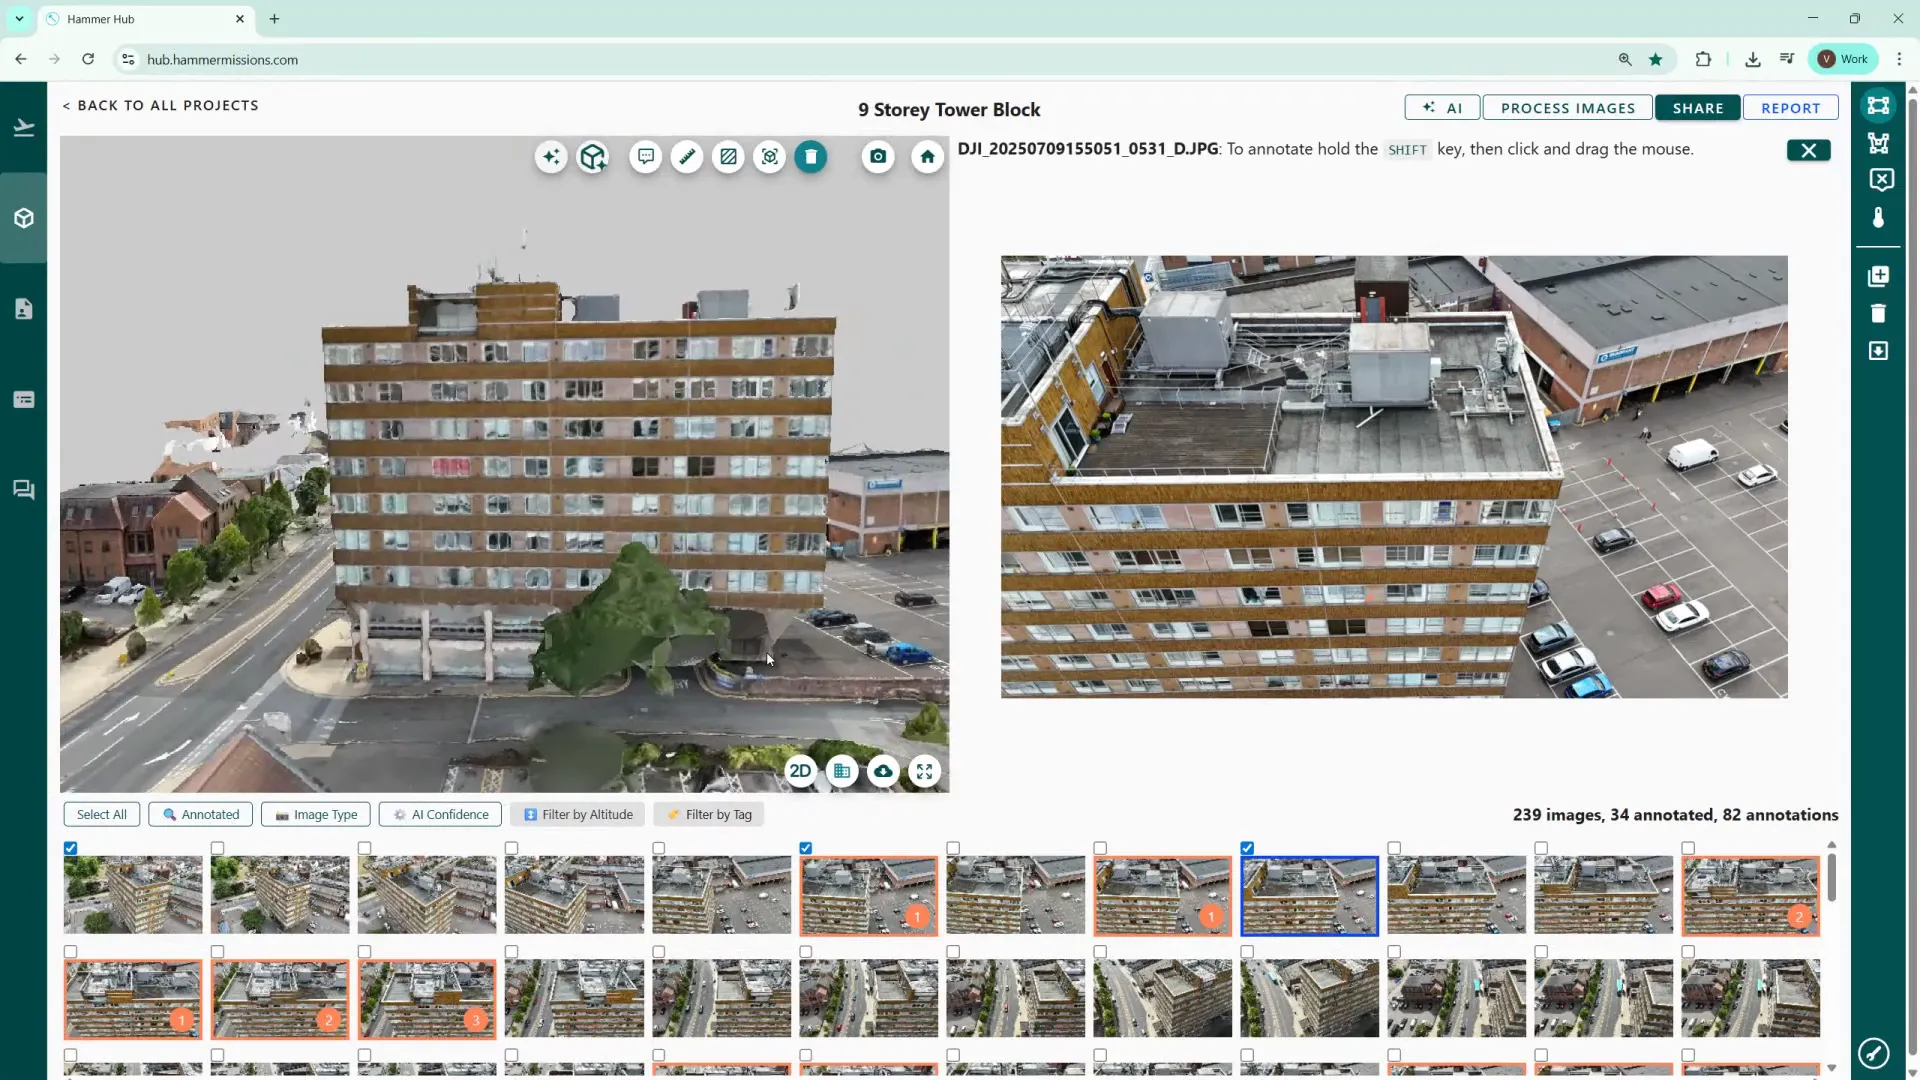
After quantification, labels appear on the left side with numbered positions identifying each deficiency on the 3D model. When the same defect appears across multiple images, the software groups them and marks the label with a 'g' (for group) prefix, to indicate multiple-image references while counting the defect only once in the inventory.
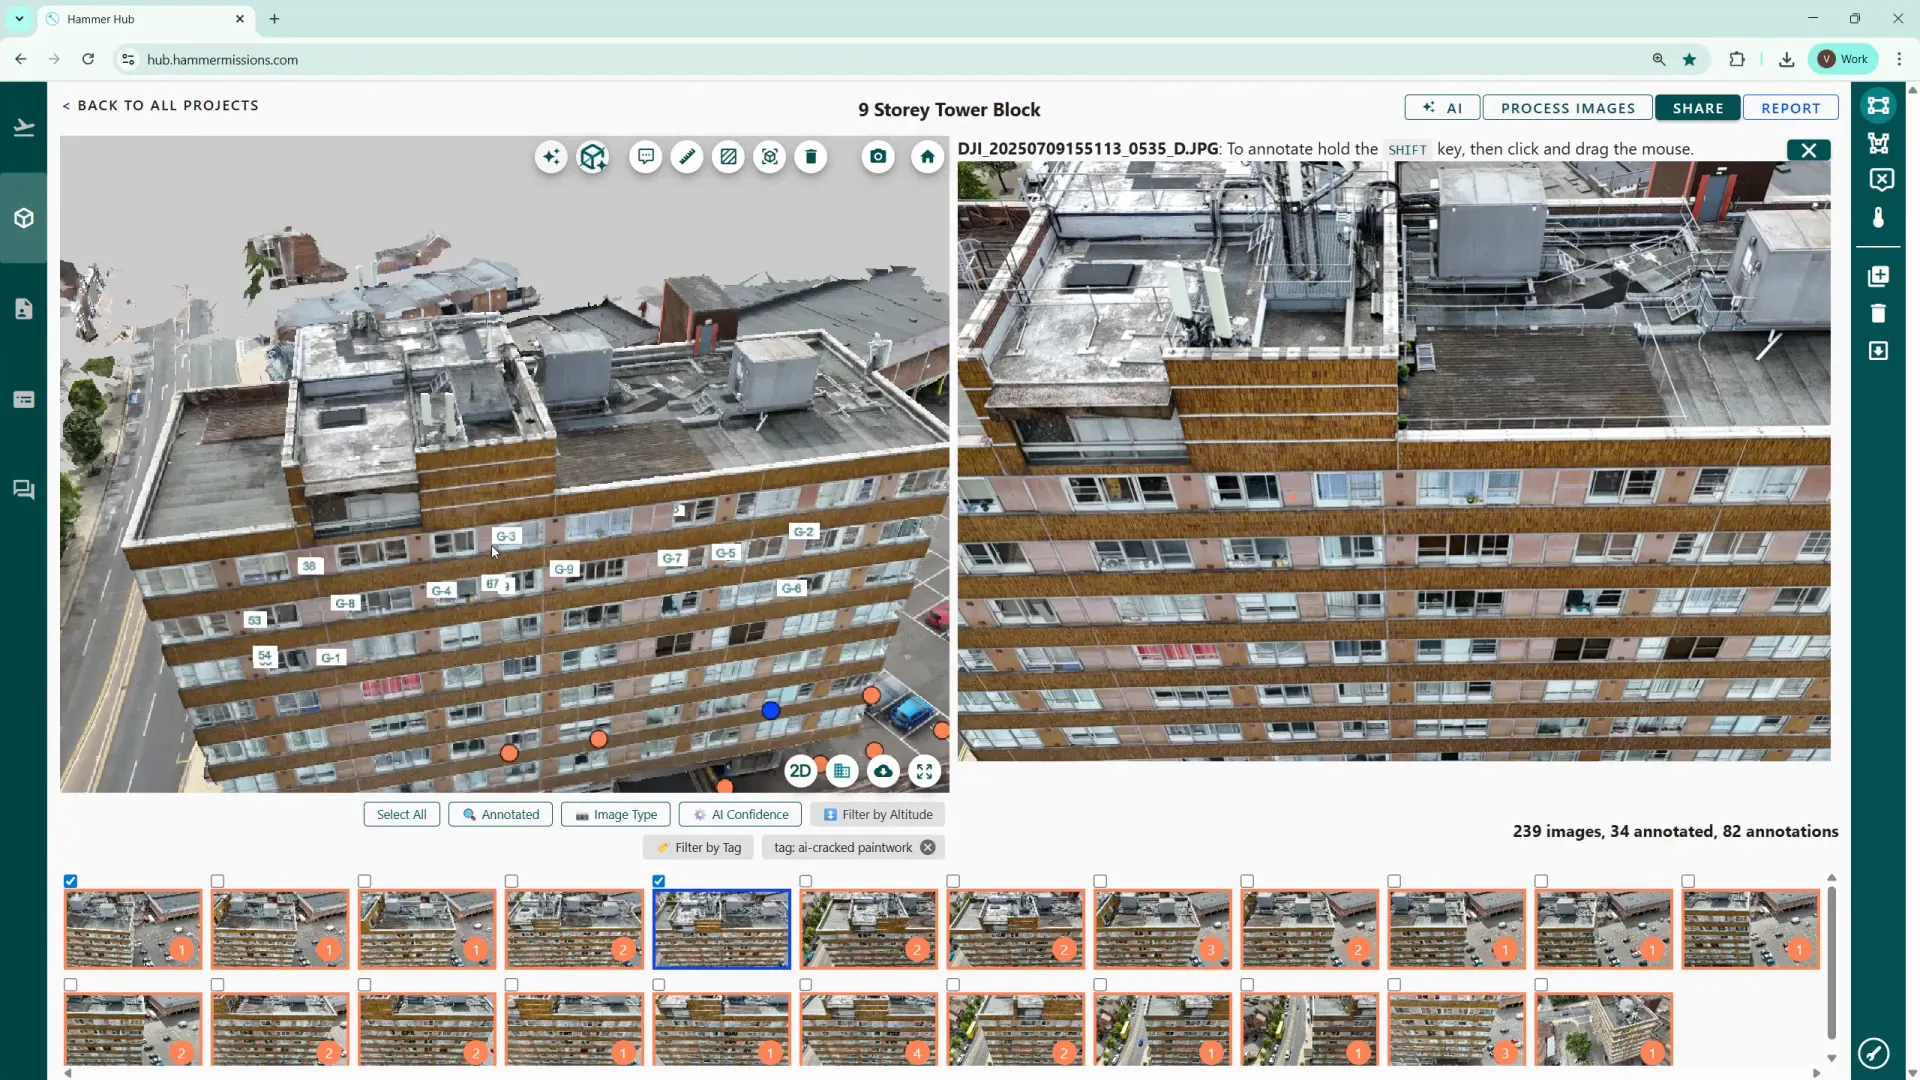
You can toggle these labels on and off using the cube-with-star icon to declutter the 3D view when you need a clear model or to show deficiency positions when preparing reports.
The 3D model screen on the left has several measurement tools:
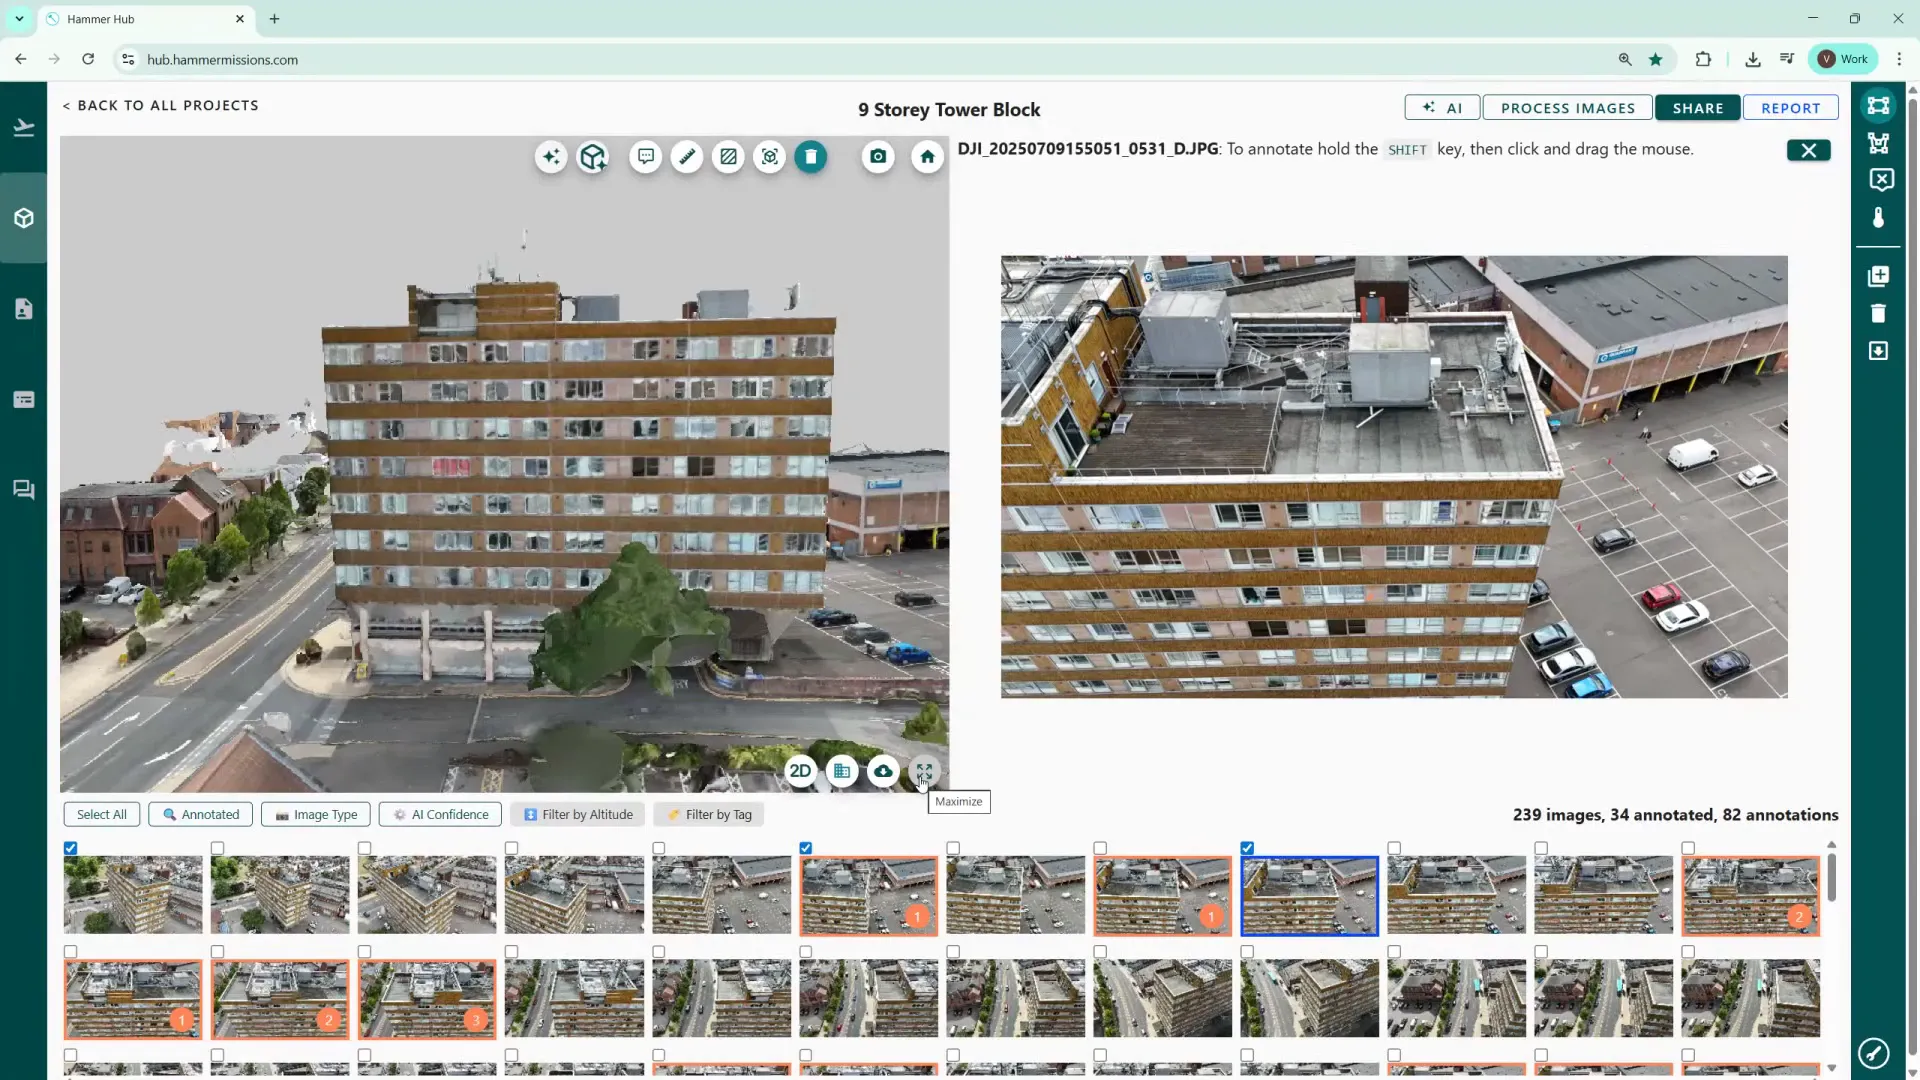
If you prefer a locked perspective (for example, a side elevation view that doesn't rotate as you move the mouse), use the second icon from the left to lock the camera perspective. This keeps the view steady for consistent inspection.
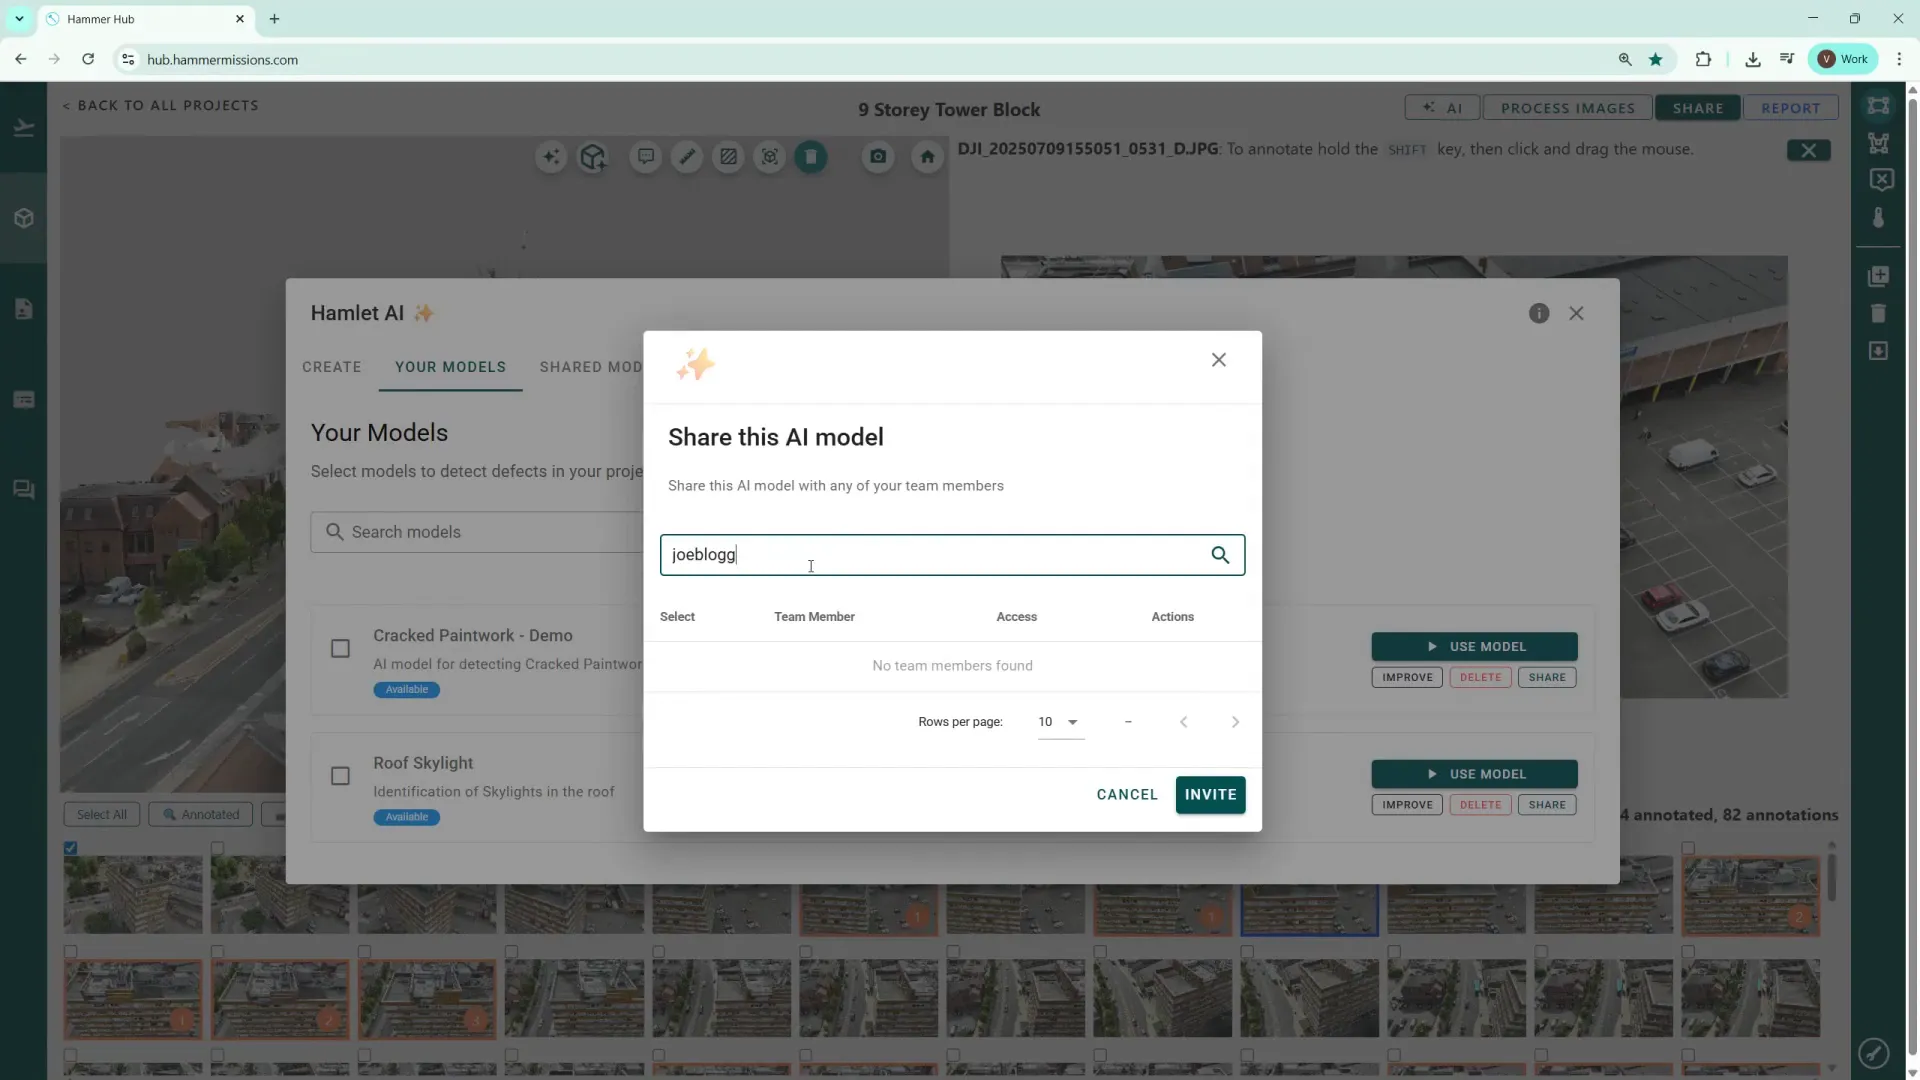
To allow colleagues use your AI model, open Your Models and use the Share button. Enter the recipient's email (they must already be registered as a user in Hammer Hub) and hit Invite. This avoids duplicate effort by allowing teammates to reuse your trained AI model on their projects.
Other useful icons include the download button for exporting the 3D model in various formats and the four‑arrow icon to toggle full‑screen 3D view (press Escape to exit full screen).
Using a trained AI model on the Hammer Missions platform, speeds up defect discovery, helps standardise reporting, and makes it easy to quantify and export results. From training with a small set of annotated images to running a full project scan and exporting CSV reports, the workflow is designed to be practical and collaborative. If you're inspecting recurring defect types across projects, sharing trained models with your team is a real time-saver.
Hopefully you found this walkthrough useful — try running a model on one of your smaller projects first to get comfortable with the confidence slider and quantification output before moving to larger portfolios.